
NZD/USD: the instrument is consolidating
30 November 2018, 09:56
| Scenario | |
|---|---|
| Timeframe | Intraday |
| Recommendation | BUY STOP |
| Entry Point | 0.6890 |
| Take Profit | 0.6954, 0.7000 |
| Stop Loss | 0.6843 |
| Key Levels | 0.6748, 0.6780, 0.6815, 0.6843, 0.6885, 0.6920, 0.6954 |
| Alternative scenario | |
|---|---|
| Recommendation | SELL STOP |
| Entry Point | 0.6835 |
| Take Profit | 0.6748, 0.6704 |
| Stop Loss | 0.6885 |
| Key Levels | 0.6748, 0.6780, 0.6815, 0.6843, 0.6885, 0.6920, 0.6954 |
Current trend
NZD showed an uncertain decline against USD on Thursday, having corrected downwards after the active growth of the instrument in the middle of the week.
USD was pressured by the speech of Fed Chairman Jerome Powell and preliminary data on US GDP for Q3 2018. In New York, Powell noted that now the interest rate is "just below" the neutral level. Powell's statement was interpreted by the market as the regulator’s readiness for a pause in rate increases. In addition, GDP data pressured the US currency according to which in Q3 2018 the figure could reach 3.5%, which is significantly less than in Q2 (4.2%).
In the evening, investors were focused on the publication of the FOMC minutes which point at rate hike in the near future.
Support and resistance
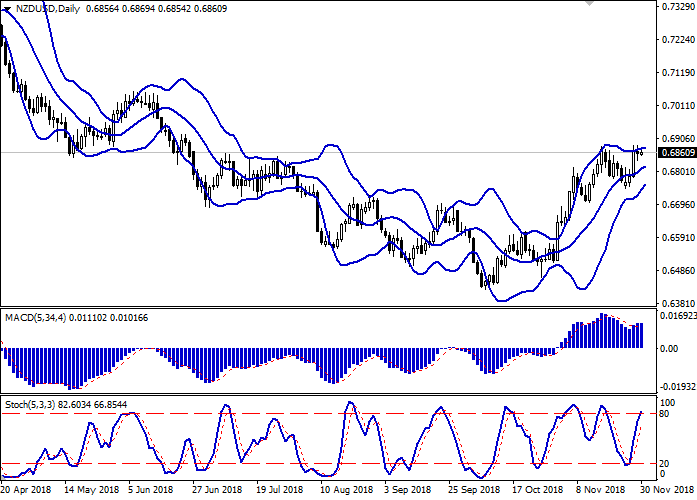
Bollinger Bands in D1 chart show moderate growth. The price range is narrowing, reflecting the emergence of ambiguous trading dynamics. MACD is growing, keeping a weak buy signal (located above the signal line). Stochastic shows a similar trend, but the indicator line is currently approaching its maximum levels, reflecting the risks associated with overbought NZD.
Existing long positions should be kept until the situation clears up. Part of the purchases can be closed by fixing the profit before the weekend.
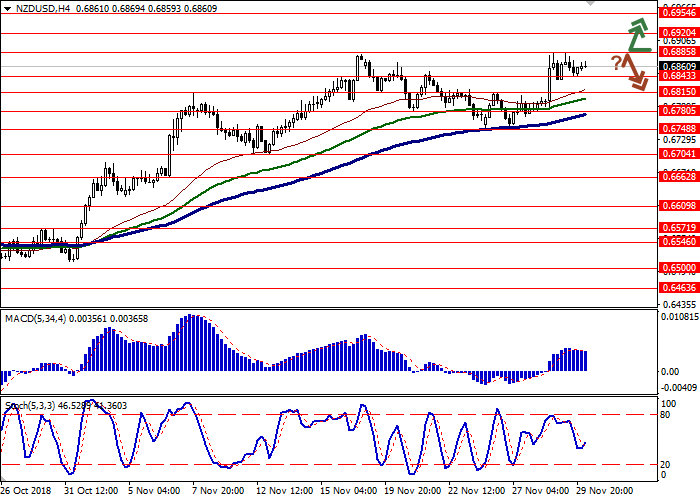
Resistance levels: 0.6885, 0.6920, 0.6954.
Support levels: 0.6843, 0.6815, 0.6780, 0.6748.
Trading tips
To open long positions, one can rely on the breakout of 0.6885. Take profit — 0.6954 or 0.7000. Stop loss — 0.6843.
The rebound from 0.6885 as from resistance with the subsequent breakdown of 0.6843 can become a signal to return to sales with target at 0.6748 or 0.6704. Stop loss — 0.6885.
Implementation period: 2-3 days.
NZD showed an uncertain decline against USD on Thursday, having corrected downwards after the active growth of the instrument in the middle of the week.
USD was pressured by the speech of Fed Chairman Jerome Powell and preliminary data on US GDP for Q3 2018. In New York, Powell noted that now the interest rate is "just below" the neutral level. Powell's statement was interpreted by the market as the regulator’s readiness for a pause in rate increases. In addition, GDP data pressured the US currency according to which in Q3 2018 the figure could reach 3.5%, which is significantly less than in Q2 (4.2%).
In the evening, investors were focused on the publication of the FOMC minutes which point at rate hike in the near future.
Support and resistance
Bollinger Bands in D1 chart show moderate growth. The price range is narrowing, reflecting the emergence of ambiguous trading dynamics. MACD is growing, keeping a weak buy signal (located above the signal line). Stochastic shows a similar trend, but the indicator line is currently approaching its maximum levels, reflecting the risks associated with overbought NZD.
Existing long positions should be kept until the situation clears up. Part of the purchases can be closed by fixing the profit before the weekend.
Resistance levels: 0.6885, 0.6920, 0.6954.
Support levels: 0.6843, 0.6815, 0.6780, 0.6748.
Trading tips
To open long positions, one can rely on the breakout of 0.6885. Take profit — 0.6954 or 0.7000. Stop loss — 0.6843.
The rebound from 0.6885 as from resistance with the subsequent breakdown of 0.6843 can become a signal to return to sales with target at 0.6748 or 0.6704. Stop loss — 0.6885.
Implementation period: 2-3 days.


No comments:
Write comments