WTI Crude Oil: oil prices have returned to decline
06 September 2018, 10:26
| Scenario | |
|---|---|
| Timeframe | Intraday |
| Recommendation | BUY LIMIT |
| Entry Point | 68.00 |
| Take Profit | 69.50, 70.00 |
| Stop Loss | 67.50, 67.40 |
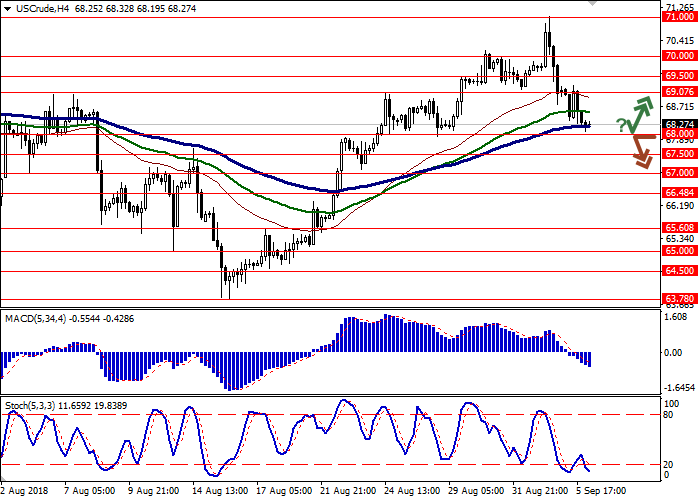
| Key Levels | 66.48, 67.00, 67.50, 68.00, 69.07, 69.50, 70.00, 71.00 |
| Alternative scenario | |
|---|---|
| Recommendation | SELL STOP |
| Entry Point | 67.90 |
| Take Profit | 67.50, 67.00 |
| Stop Loss | 68.30, 68.40 |
| Key Levels | 66.48, 67.00, 67.50, 68.00, 69.07, 69.50, 70.00, 71.00 |
Current trend
Prices for WTI crude oil showed a steady decline during the last two days after the update of the local high of July 11 on Tuesday. The downward movement is due to the tropical storm "Gordon" moving away from the main oil production areas.
The correction was supported by USD strengthening after the release of strong US Manufacturing PMI data. The price is under pressure of the decision of the Indian authorities to allow local importers to use Iranian tankers to deliver oil to India.
In turn, the API Weekly Crude Oil Stock published on Wednesday provided moderate support to the prices. According to the data received, over the week by August 31, stocks in warehouses in the US fell by 1.200M barrels after an increase of 0.038M barrels in the previous period.
Support and resistance
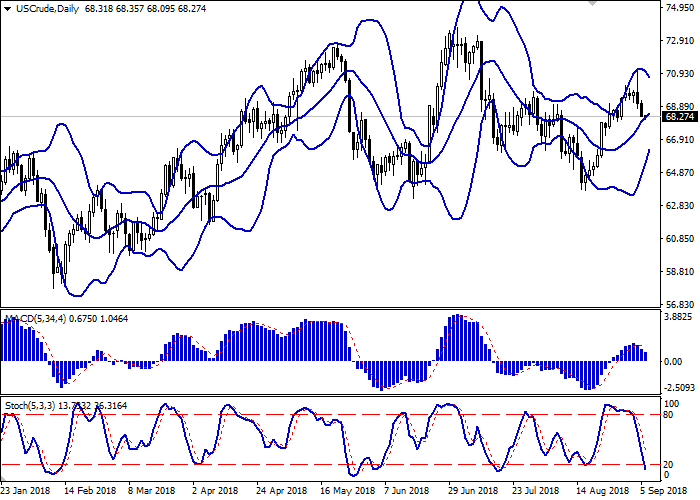
Bollinger Bands in D1 chart show moderate growth. The price range is narrowing, reflecting a sharp change of trend in the short term. MACD is going down keeping a moderate sell signal (located below the signal line). Stochastic is declining almost vertically and is currently approaching its minimum levels, pointing to the oversoldness of the instrument in the ultra-short term.
Existing short positions should be kept until the situation clears up.
Resistance levels: 69.07, 69.50, 70.00, 71.00.
Support levels: 68.00, 67.50, 67.00, 66.48.


Trading tips
To open long positions, one can rely on the rebound from the level of 68.00 as from support. Take profit — 69.50 or 70.00. Stop loss — 67.50 or 67.40. Implementation period: 2-3 days.
A breakdown of 68.00 may be a signal to further sales with target at 67.50 or 67.00. Stop loss — 68.30 or 68.40. Implementation period: 1-2 days.
Prices for WTI crude oil showed a steady decline during the last two days after the update of the local high of July 11 on Tuesday. The downward movement is due to the tropical storm "Gordon" moving away from the main oil production areas.
The correction was supported by USD strengthening after the release of strong US Manufacturing PMI data. The price is under pressure of the decision of the Indian authorities to allow local importers to use Iranian tankers to deliver oil to India.
In turn, the API Weekly Crude Oil Stock published on Wednesday provided moderate support to the prices. According to the data received, over the week by August 31, stocks in warehouses in the US fell by 1.200M barrels after an increase of 0.038M barrels in the previous period.
Support and resistance
Bollinger Bands in D1 chart show moderate growth. The price range is narrowing, reflecting a sharp change of trend in the short term. MACD is going down keeping a moderate sell signal (located below the signal line). Stochastic is declining almost vertically and is currently approaching its minimum levels, pointing to the oversoldness of the instrument in the ultra-short term.
Existing short positions should be kept until the situation clears up.
Resistance levels: 69.07, 69.50, 70.00, 71.00.
Support levels: 68.00, 67.50, 67.00, 66.48.


Trading tips
To open long positions, one can rely on the rebound from the level of 68.00 as from support. Take profit — 69.50 or 70.00. Stop loss — 67.50 or 67.40. Implementation period: 2-3 days.
A breakdown of 68.00 may be a signal to further sales with target at 67.50 or 67.00. Stop loss — 68.30 or 68.40. Implementation period: 1-2 days.


No comments:
Write comments