
USD/CHF: USD is strengthening
10 September 2018, 10:16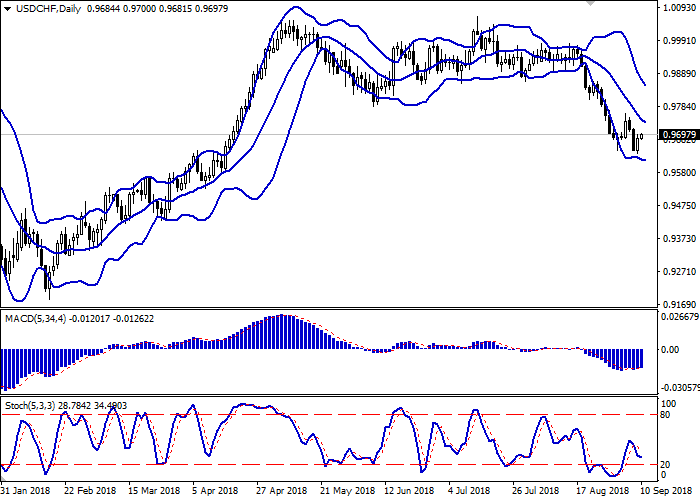
| Scenario | |
|---|---|
| Timeframe | Intraday |
| Recommendation | BUY STOP |
| Entry Point | 0.9710 |
| Take Profit | 0.9785, 0.9800, 0.9820 |
| Stop Loss | 0.9660, 0.9650 |
| Key Levels | 0.9600, 0.9639, 0.9673, 0.9700, 0.9730, 0.9760, 0.9785 |
| Alternative scenario | |
|---|---|
| Recommendation | SELL STOP |
| Entry Point | 0.9665 |
| Take Profit | 0.9620, 0.9600 |
| Stop Loss | 0.9710 |
| Key Levels | 0.9600, 0.9639, 0.9673, 0.9700, 0.9730, 0.9760, 0.9785 |
Current trend
USD reversed in the direction of growth on Friday, having updated local lows of April 17. USD gained support from the strong August report on the US labor market, as well as from a number of technical correctional factors of the majors before the weekend.
In turn, CHF came under pressure after the publication of statistics on the GDP of the eurozone and the data from Germany. Eurozone GDP increased by 2.1% in Q2 2018, which is lower than the previous figure (2.2%). Industrial production in Germany YoY increased by 1.1% instead of the expected 2.6%, and decreased by 1.1% MoM. Germany's trade surplus in July fell from EUR 19.3 to 15.8 billion. Also, investors are worried by reports from the American press that the US can increase trade pressure on Japan.
Support and resistance
On the D1 chart, Bollinger Bands are gradually reversing horizontally. The price range is narrowing, reflecting quite sharp change of trend in the short term. MACD is growing keeping a weak buy signal (located above the signal line). Stochastic has reversed horizontally near the "20" level, which can be called a formal border of oversold USD.
It is worth looking into the possibility of the upward correction in the short and/or ultra-short term.
Resistance levels: 0.9700, 0.9730, 0.9760, 0.9785.
Support levels: 0.9673, 0.9639, 0.9600.
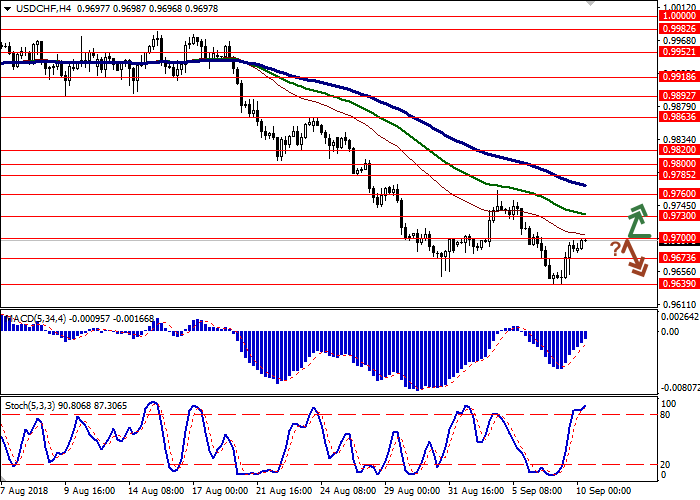

Trading tips
To open long positions, one can rely on the breakout of 0.9700. Take profit — 0.9785 or 0.9800, 0.9820. Stop loss — 0.9660 or 0.9650.
The rebound from 0.9700 as from resistance with the subsequent breakdown of 0.9673 can become a signal to return to sales with target at 0.9620 or 0.9600. Stop loss – 0.9710.
Implementation period: 2-3 days.
USD reversed in the direction of growth on Friday, having updated local lows of April 17. USD gained support from the strong August report on the US labor market, as well as from a number of technical correctional factors of the majors before the weekend.
In turn, CHF came under pressure after the publication of statistics on the GDP of the eurozone and the data from Germany. Eurozone GDP increased by 2.1% in Q2 2018, which is lower than the previous figure (2.2%). Industrial production in Germany YoY increased by 1.1% instead of the expected 2.6%, and decreased by 1.1% MoM. Germany's trade surplus in July fell from EUR 19.3 to 15.8 billion. Also, investors are worried by reports from the American press that the US can increase trade pressure on Japan.
Support and resistance
On the D1 chart, Bollinger Bands are gradually reversing horizontally. The price range is narrowing, reflecting quite sharp change of trend in the short term. MACD is growing keeping a weak buy signal (located above the signal line). Stochastic has reversed horizontally near the "20" level, which can be called a formal border of oversold USD.
It is worth looking into the possibility of the upward correction in the short and/or ultra-short term.
Resistance levels: 0.9700, 0.9730, 0.9760, 0.9785.
Support levels: 0.9673, 0.9639, 0.9600.
Trading tips
To open long positions, one can rely on the breakout of 0.9700. Take profit — 0.9785 or 0.9800, 0.9820. Stop loss — 0.9660 or 0.9650.
The rebound from 0.9700 as from resistance with the subsequent breakdown of 0.9673 can become a signal to return to sales with target at 0.9620 or 0.9600. Stop loss – 0.9710.
Implementation period: 2-3 days.


No comments:
Write comments