
Bitcoin: technical analysis
10 September 2018, 11:17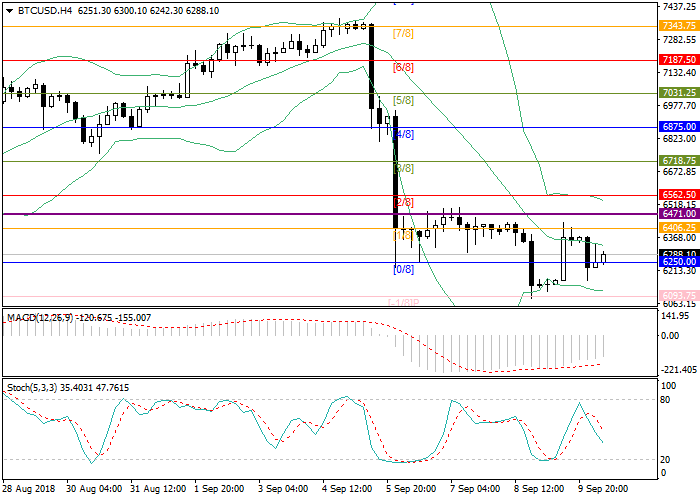
| Scenario | |
|---|---|
| Timeframe | Intraday |
| Recommendation | SELL STOP |
| Entry Point | 6240.00 |
| Take Profit | 6093.75 |
| Stop Loss | 6300.00 |
| Key Levels | 5937.00, 6093.75, 6250.00, 6406.25, 6562.50, 6718.75 |
| Alternative scenario | |
|---|---|
| Recommendation | BUY STOP |
| Entry Point | 6410.00 |
| Take Profit | 6562.50 |
| Stop Loss | 6360.00 |
| Key Levels | 5937.00, 6093.75, 6250.00, 6406.25, 6562.50, 6718.75 |
Current trend
After a significant decline, quotes of Bitcoin are moving within the range of 6082.10–6436.30. Currently, a slight upward correction is observed, but the downtrend is still maintained. The level of 6325.00 corresponding to the center line of Bollinger Bands is the main target of the upward correction. A reversal and a resumption of a downtrend from the level of 6325.00 is likely, while breaking out and consolidation of the rate above this level will open the Bitcoin path to the levels of 6406.25 (Murrey [1/8])–6562.50 (Murrey [2/8]). Technical indicators show that downward movement potential is preserved. Bollinger Bands and Stochastic lines are directed downwards. The volumes of MACD decreased slightly in the negative zone, indicating the likely development of an upward correction.
Support and resistance
Resistance levels: 6406.25, 6562.50, 6718.75.
Support levels: 6250.00, 6093.75, 5937.50.

Trading tips
Sell positions may be opened below 6250.00 with target at 6093.75 and stop loss at 6300.00.
Buy positions may be opened above 6406.25 with target at 6562.50 and stop loss at 6360.00.
After a significant decline, quotes of Bitcoin are moving within the range of 6082.10–6436.30. Currently, a slight upward correction is observed, but the downtrend is still maintained. The level of 6325.00 corresponding to the center line of Bollinger Bands is the main target of the upward correction. A reversal and a resumption of a downtrend from the level of 6325.00 is likely, while breaking out and consolidation of the rate above this level will open the Bitcoin path to the levels of 6406.25 (Murrey [1/8])–6562.50 (Murrey [2/8]). Technical indicators show that downward movement potential is preserved. Bollinger Bands and Stochastic lines are directed downwards. The volumes of MACD decreased slightly in the negative zone, indicating the likely development of an upward correction.
Support and resistance
Resistance levels: 6406.25, 6562.50, 6718.75.
Support levels: 6250.00, 6093.75, 5937.50.
Trading tips
Sell positions may be opened below 6250.00 with target at 6093.75 and stop loss at 6300.00.
Buy positions may be opened above 6406.25 with target at 6562.50 and stop loss at 6360.00.


No comments:
Write comments