
XAU/USD: gold prices are falling
16 August 2018, 11:07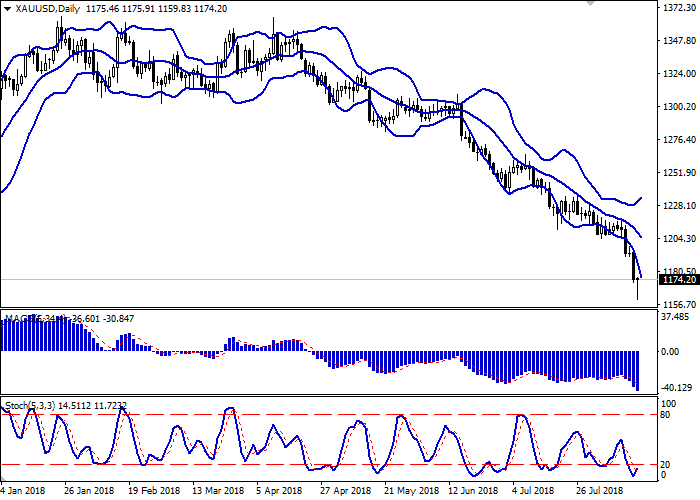
| Scenario | |
|---|---|
| Timeframe | Intraday |
| Recommendation | BUY STOP |
| Entry Point | 1180.00 |
| Take Profit | 1193.68, 1200.00 |
| Stop Loss | 1170.00 |
| Key Levels | 1159.83, 1170.00, 1179.96, 1187.96, 1194.68, 1200.00 |
| Alternative scenario | |
|---|---|
| Recommendation | SELL STOP |
| Entry Point | 1169.90 |
| Take Profit | 1159.83, 1155.00 |
| Stop Loss | 1177.00 |
| Key Levels | 1159.83, 1170.00, 1179.96, 1187.96, 1194.68, 1200.00 |
Current trend
Yesterday, gold prices fell, renewing the low since January 2017. The aggressive sales were due to the growing fears of the economic crisis in Turkey, as well as the relatively strong positions of USD, strengthened after rather harsh statements by Turkish President Tayyip Erdogan. In addition, gold is under pressure of the anticipation of Fed’s interest rate increase in the next month.
Today, the instrument is moving within the sideways trend. The confident decline at the opening of the trading session was balanced by the corrective moods of traders, closing profitable positions before the weekend. At the end of the week, there is no key US macroeconomic statistics expected, so the old drivers will remain relevant.
Support and resistance
On the daily chart, Bollinger bands are steadily declining. The price range is widening, but not as fast as the "bearish" moods are developing. MACD indicator decreases, strengthening its "bearish" signal (the histogram is below the signal line). Stochastic reverses upwards after reaching its lows. Its readings indicate that the instrument is strongly oversold in the very short term.
The corrective growth is possible at the end of the current trading week.
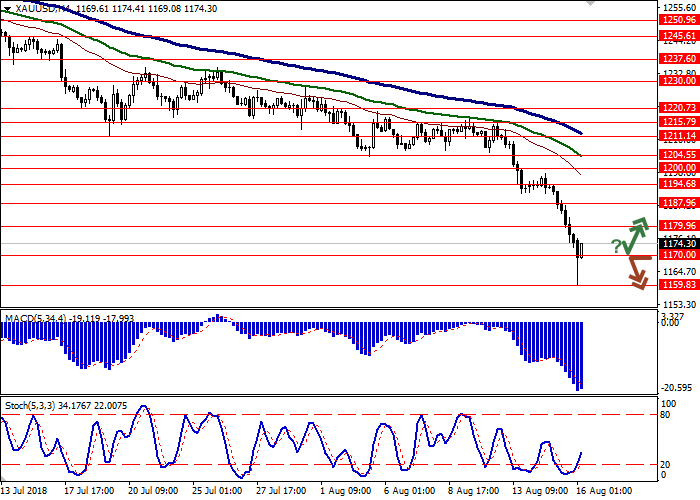
Resistance levels: 1179.96, 1187.96, 1194.68, 1200.00.
Support levels: 1170.00, 1159.83.

Trading tips
Long positions can be opened after a rebound from the level of 1170.00 and breakout of the level 1179.96 with the target at 1193.68 or 1200.00 and stop loss 1170.00. Implementation period: 2–3 days.
Short positions can be opened after the breakdown of the level 1170.00 with the target at 1159.83 or 1155.00 and stop loss 1177.00. Implementation period: 1–2 days.
Yesterday, gold prices fell, renewing the low since January 2017. The aggressive sales were due to the growing fears of the economic crisis in Turkey, as well as the relatively strong positions of USD, strengthened after rather harsh statements by Turkish President Tayyip Erdogan. In addition, gold is under pressure of the anticipation of Fed’s interest rate increase in the next month.
Today, the instrument is moving within the sideways trend. The confident decline at the opening of the trading session was balanced by the corrective moods of traders, closing profitable positions before the weekend. At the end of the week, there is no key US macroeconomic statistics expected, so the old drivers will remain relevant.
Support and resistance
On the daily chart, Bollinger bands are steadily declining. The price range is widening, but not as fast as the "bearish" moods are developing. MACD indicator decreases, strengthening its "bearish" signal (the histogram is below the signal line). Stochastic reverses upwards after reaching its lows. Its readings indicate that the instrument is strongly oversold in the very short term.
The corrective growth is possible at the end of the current trading week.
Resistance levels: 1179.96, 1187.96, 1194.68, 1200.00.
Support levels: 1170.00, 1159.83.
Trading tips
Long positions can be opened after a rebound from the level of 1170.00 and breakout of the level 1179.96 with the target at 1193.68 or 1200.00 and stop loss 1170.00. Implementation period: 2–3 days.
Short positions can be opened after the breakdown of the level 1170.00 with the target at 1159.83 or 1155.00 and stop loss 1177.00. Implementation period: 1–2 days.


No comments:
Write comments