
NZD/USD: the instrument is consolidated
16 August 2018, 10:52
| Scenario | |
|---|---|
| Timeframe | Intraday |
| Recommendation | BUY STOP |
| Entry Point | 0.6610, 0.6630 |
| Take Profit | 0.6700, 0.6712, 0.6746 |
| Stop Loss | 0.6580, 0.6560 |
| Key Levels | 0.6500, 0.6543, 0.6560, 0.6600, 0.6622, 0.6650, 0.6686 |
| Alternative scenario | |
|---|---|
| Recommendation | SELL STOP |
| Entry Point | 0.6555, 0.6535 |
| Take Profit | 0.6500, 0.6480, 0.6475 |
| Stop Loss | 0.6600 |
| Key Levels | 0.6500, 0.6543, 0.6560, 0.6600, 0.6622, 0.6650, 0.6686 |
Current trend
Yesterday, NZD fell slightly against USD, renewing the lows since February 2016.
Published on Wednesday, data on retail sales in the US were stronger than market expectations. In July, their volume increased by 0.5%, instead of the expected growth of 0.1%. However, the data on industrial production in the US turned out to be much weaker – in July the indicator fell from 1.0% to 0.1%.
On Wednesday, the Turkish government continued to aggravate relations with the United States. The increased duties on more than 20 types of goods supplied to Turkey from the United States were introduced. In particular, the tariffs for alcoholic beverages were increased by 140%, for cars – by 120%, for tobacco – by 60%, for cosmetics – by 60%, for coal – by 13.7%. Such duties became a response to the increase by the US administration of aluminum tariffs to 20%, and tariffs for steel to 50%.
Support and resistance
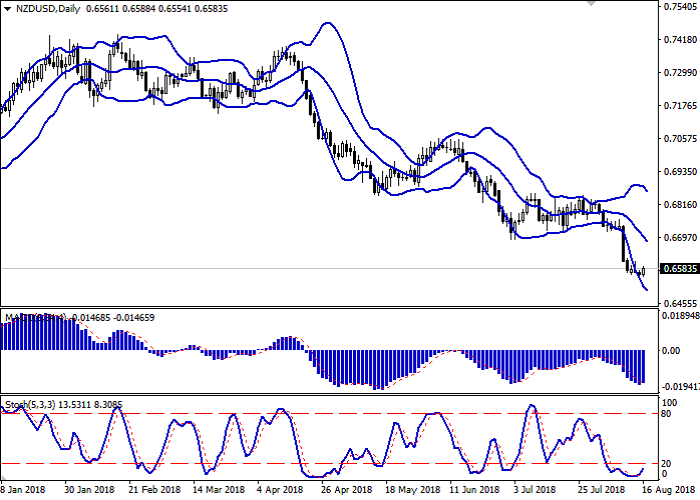
On the daily chart, Bollinger bands are steadily declining. The price range widens from below, allowing "bearish" moods to develop in the short term. MACD indicator reverses upwards, forming a new "bullish" signal (the histogram tries to consolidate the signal line). Stochastic reverses upwards after a long flat near the zero line.
Current indicators readings reflect a growing risk of corrective growth in the short and/or ultra-short term.
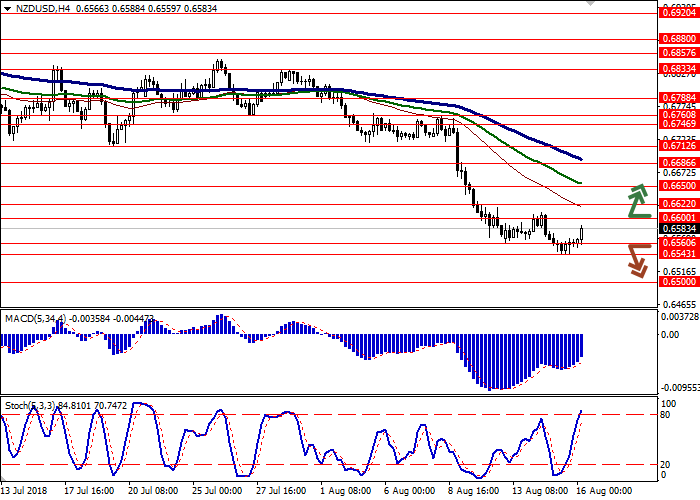
Resistance levels: 0.6600, 0.6622, 0.6650, 0.6686.
Support levels: 0.6560, 0.6543, 0.6500.
Trading tips
Long positions can be opened after the breakout of the levels 0.6600–0.6622 with the targets at 0.6700–0.6712 or 0.6746 and stop loss 0.6580–0.6560.
Short positions can be opened after the breakdown of the levels 0.6560–0.6543 with the targets at 0.6500 or 0.6480–0.6475 and stop loss 0.6600.
Implementation period: 2–3 days.
Yesterday, NZD fell slightly against USD, renewing the lows since February 2016.
Published on Wednesday, data on retail sales in the US were stronger than market expectations. In July, their volume increased by 0.5%, instead of the expected growth of 0.1%. However, the data on industrial production in the US turned out to be much weaker – in July the indicator fell from 1.0% to 0.1%.
On Wednesday, the Turkish government continued to aggravate relations with the United States. The increased duties on more than 20 types of goods supplied to Turkey from the United States were introduced. In particular, the tariffs for alcoholic beverages were increased by 140%, for cars – by 120%, for tobacco – by 60%, for cosmetics – by 60%, for coal – by 13.7%. Such duties became a response to the increase by the US administration of aluminum tariffs to 20%, and tariffs for steel to 50%.
Support and resistance
On the daily chart, Bollinger bands are steadily declining. The price range widens from below, allowing "bearish" moods to develop in the short term. MACD indicator reverses upwards, forming a new "bullish" signal (the histogram tries to consolidate the signal line). Stochastic reverses upwards after a long flat near the zero line.
Current indicators readings reflect a growing risk of corrective growth in the short and/or ultra-short term.
Resistance levels: 0.6600, 0.6622, 0.6650, 0.6686.
Support levels: 0.6560, 0.6543, 0.6500.
Trading tips
Long positions can be opened after the breakout of the levels 0.6600–0.6622 with the targets at 0.6700–0.6712 or 0.6746 and stop loss 0.6580–0.6560.
Short positions can be opened after the breakdown of the levels 0.6560–0.6543 with the targets at 0.6500 or 0.6480–0.6475 and stop loss 0.6600.
Implementation period: 2–3 days.


No comments:
Write comments