
GBP/USD: the pair is in flat
16 August 2018, 10:27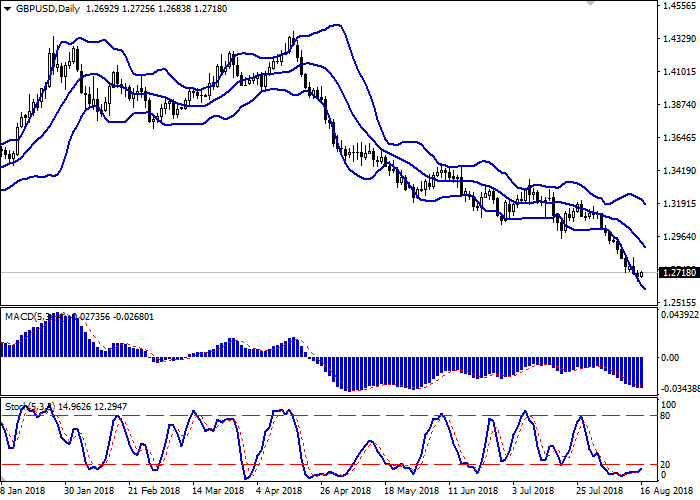
| Scenario | |
|---|---|
| Timeframe | Intraday |
| Recommendation | BUY STOP |
| Entry Point | 1.2740 |
| Take Profit | 1.2900, 1.2956 |
| Stop Loss | 1.2650 |
| Key Levels | 1.2600, 1.2634, 1.2673, 1.2732, 1.2800, 1.2850, 1.2900 |
| Alternative scenario | |
|---|---|
| Recommendation | SELL STOP |
| Entry Point | 1.2665 |
| Take Profit | 1.2600 |
| Stop Loss | 1.2730 |
| Key Levels | 1.2600, 1.2634, 1.2673, 1.2732, 1.2800, 1.2850, 1.2900 |
Current trend
The British currency slightly decreased against the US dollar on Wednesday, August 15, updating the lows of June 2016.
On Wednesday in Great Britain a large block of economic statistics was published, the most important data being the inflation statistics for July. Expectations of investors were justified – the basic consumer price index remained at around 1.9%, and the consumer price index increased from 2.4% to 2.5% due to the increase in the cost of transport and computer games. Thus, the trend continues to decline in wages and inflation (now 2.7% vs. 2.5%), not so positive for the British economy.
On Thursday, the market is waiting for the publication of July’s data on retail sales in the UK. Indicators promise to be strong and can support the British currency. The indicator of the volume of retail sales on an annual basis may increase from 2.9% to 3.0%, and on a monthly basis from -0.5% to 0.2%.
Support and resistance
Bollinger bands on the daily chart are directed downwards. The price range is narrowing in the upper part, reflecting a slowdown in the "bearish" trend and the emergence of flat dynamics in the short term. The MACD indicator is slightly turning upwards, retaining the previous sell signal (the histogram is below the signal line). Stochastics is still in the oversold zone.
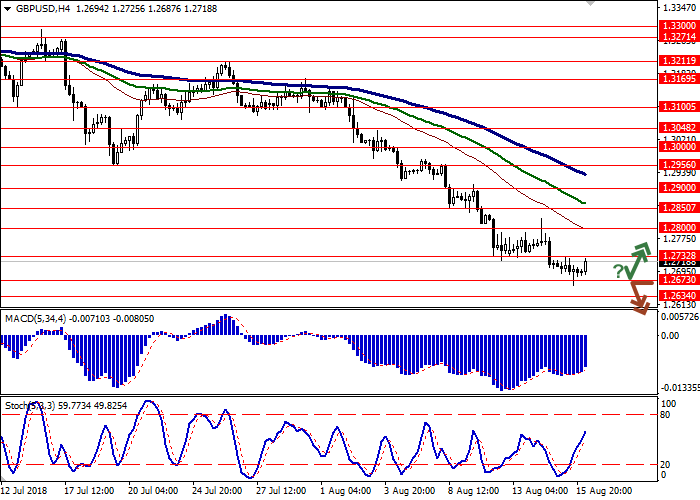
Resistance levels: 1.2732, 1.2800, 1.2850, 1.2900.
Support levels: 1.2673, 1.2634, 1.2600.

Trading tips
To open long positions, you can rely on the breakout of 1.2732. Take profit – 1.2900 or 1.2956. Stop loss – 1.2650. Term of realization: 2-3 days.
Breakdown of 1.2673 may be a signal for further sales with a target of 1.2600. Stop loss – 1.2730. Term of realization: 1-2 days.
The British currency slightly decreased against the US dollar on Wednesday, August 15, updating the lows of June 2016.
On Wednesday in Great Britain a large block of economic statistics was published, the most important data being the inflation statistics for July. Expectations of investors were justified – the basic consumer price index remained at around 1.9%, and the consumer price index increased from 2.4% to 2.5% due to the increase in the cost of transport and computer games. Thus, the trend continues to decline in wages and inflation (now 2.7% vs. 2.5%), not so positive for the British economy.
On Thursday, the market is waiting for the publication of July’s data on retail sales in the UK. Indicators promise to be strong and can support the British currency. The indicator of the volume of retail sales on an annual basis may increase from 2.9% to 3.0%, and on a monthly basis from -0.5% to 0.2%.
Support and resistance
Bollinger bands on the daily chart are directed downwards. The price range is narrowing in the upper part, reflecting a slowdown in the "bearish" trend and the emergence of flat dynamics in the short term. The MACD indicator is slightly turning upwards, retaining the previous sell signal (the histogram is below the signal line). Stochastics is still in the oversold zone.
Resistance levels: 1.2732, 1.2800, 1.2850, 1.2900.
Support levels: 1.2673, 1.2634, 1.2600.
Trading tips
To open long positions, you can rely on the breakout of 1.2732. Take profit – 1.2900 or 1.2956. Stop loss – 1.2650. Term of realization: 2-3 days.
Breakdown of 1.2673 may be a signal for further sales with a target of 1.2600. Stop loss – 1.2730. Term of realization: 1-2 days.


No comments:
Write comments