
AUD/USD: general analysis
16 August 2018, 11:15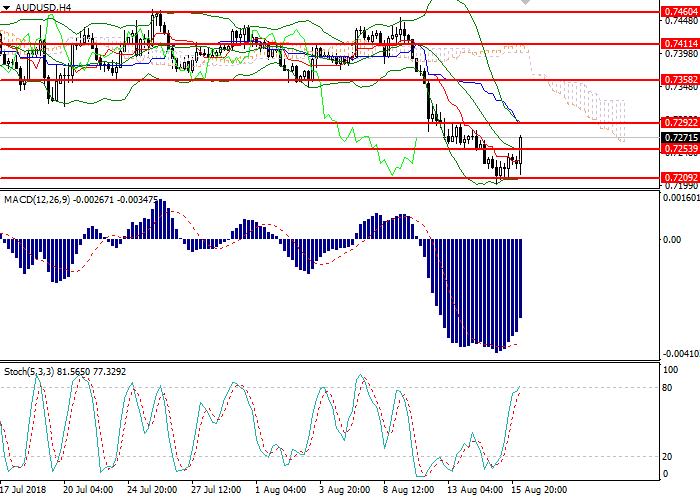
| Scenario | |
|---|---|
| Timeframe | Intraday |
| Recommendation | SELL |
| Entry Point | 0.7267 |
| Take Profit | 0.7150, 0.7130 |
| Stop Loss | 0.7300 |
| Key Levels | 0.7092, 0.7163, 0.7210, 0.7253, 0.7292, 0.7358, 0.7411, 0.7460, 0.7510 |
| Alternative scenario | |
|---|---|
| Recommendation | BUY STOP |
| Entry Point | 0.7310 |
| Take Profit | 0.7340 |
| Stop Loss | 0.7285 |
| Key Levels | 0.7092, 0.7163, 0.7210, 0.7253, 0.7292, 0.7358, 0.7411, 0.7460, 0.7510 |
Current trend
The pair AUD/USD is trading near the minimum since January 2017.
AUD is under pressure of Chinese economy slowing. On Tuesday, the National Bureau of Statistics of China published poor Retail Sales and Industrial Production releases. However, yesterday the market ignored the growth in US July Retail Sales. Traders prefer not to risk and invest in USD, as the US economy is more stable.
Today, the instrument has insignificantly strengthened after the Australian Bureau of Statistics reported a 0.1% drop in unemployment in July. However, USD will grow due to tight Brexit, the crisis in emerging markets, the significant risks in the European banking system and the dependence of commodity currencies on the PRC economy.
Today at 14:30 (GMT+2) investors expect the publication of US statistics on employment and housing market. If the positive predictions are confirmed, the pair will breakdown the level of psychological support of 0.7200 and decrease to 0.7130–0.7100.
Support and resistance
On the 4-hour chart, the instrument tests the MA of Bollinger Bands. The indicator is directed downwards, and the price range widened, which reflects the change of dynamics to the downwards one. MACD is in the negative area, keeping the sell signal. Stochastic is ready to enter the overbought area and can form a strong sell signal during the day.
Resistance levels: 0.7253, 0.7292, 0.7358, 0.7411, 0.7460, 0.7510.
Support levels: 0.7210, 0.7163, 0.7092.

Trading tips
Short positions can be opened from the current level with the targets at 0.7150 0.7130 and stop loss 0.7300. Implementation period: 1–3 days.
Long positions can be opened above the level of 0.7300 with the target at 0.7340 and stop loss 0.7285. Implementation period: 1 day.
The pair AUD/USD is trading near the minimum since January 2017.
AUD is under pressure of Chinese economy slowing. On Tuesday, the National Bureau of Statistics of China published poor Retail Sales and Industrial Production releases. However, yesterday the market ignored the growth in US July Retail Sales. Traders prefer not to risk and invest in USD, as the US economy is more stable.
Today, the instrument has insignificantly strengthened after the Australian Bureau of Statistics reported a 0.1% drop in unemployment in July. However, USD will grow due to tight Brexit, the crisis in emerging markets, the significant risks in the European banking system and the dependence of commodity currencies on the PRC economy.
Today at 14:30 (GMT+2) investors expect the publication of US statistics on employment and housing market. If the positive predictions are confirmed, the pair will breakdown the level of psychological support of 0.7200 and decrease to 0.7130–0.7100.
Support and resistance
On the 4-hour chart, the instrument tests the MA of Bollinger Bands. The indicator is directed downwards, and the price range widened, which reflects the change of dynamics to the downwards one. MACD is in the negative area, keeping the sell signal. Stochastic is ready to enter the overbought area and can form a strong sell signal during the day.
Resistance levels: 0.7253, 0.7292, 0.7358, 0.7411, 0.7460, 0.7510.
Support levels: 0.7210, 0.7163, 0.7092.
Trading tips
Short positions can be opened from the current level with the targets at 0.7150 0.7130 and stop loss 0.7300. Implementation period: 1–3 days.
Long positions can be opened above the level of 0.7300 with the target at 0.7340 and stop loss 0.7285. Implementation period: 1 day.


No comments:
Write comments