
XAU/USD: gold prices are consolidating
08 August 2018, 10:41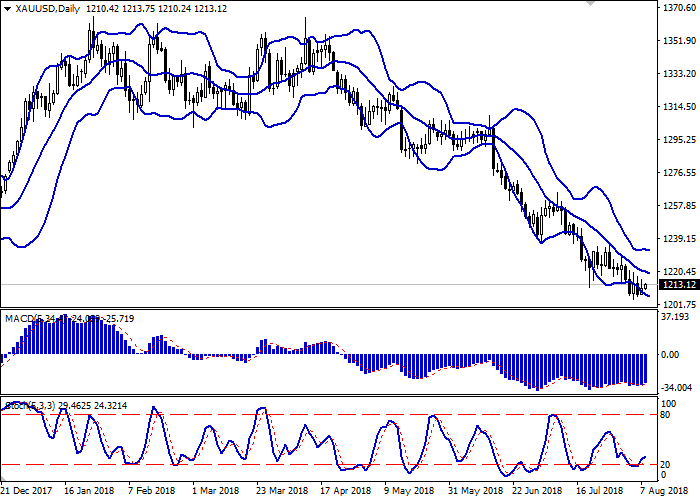
| Scenario | |
|---|---|
| Timeframe | Intraday |
| Recommendation | BUY STOP |
| Entry Point | 1215.85, 1220.80 |
| Take Profit | 1230.00, 1233.00 |
| Stop Loss | 1213.00, 1207.00 |
| Key Levels | 1200.00, 1204.55, 1211.14, 1215.79, 1220.73, 1230.00, 1237.60 |
| Alternative scenario | |
|---|---|
| Recommendation | SELL STOP |
| Entry Point | 1211.10 |
| Take Profit | 1200.00 |
| Stop Loss | 1218.00 |
| Key Levels | 1200.00, 1204.55, 1211.14, 1215.79, 1220.73, 1230.00, 1237.60 |
Current trend
Gold prices showed a slight increase on Tuesday, partially offsetting the decline in quotations at the beginning of the week. The growth of the asset was facilitated by the decline in USD against certain instruments due to the approval of new US sanctions against Iran.
Additional support for gold was provided by the growth of the yuan, due to a certain decrease in the tension in the trade relations between the US and China.
Today, the instrument also is trading with a raise. Investors focus on the block of statistics on exports and imports from China. In July, exports rose by 12.2% YoY after growing by 11.2% YoY last month. Imports accelerated from +14.1% YoY to +27.3% YoY, which was significantly higher than forecasts (+16.2% YoY). Such a sharp increase in imports led to a reduction in the trade surplus from USD 41.47B to 28.05B.
Support and resistance
Bollinger Bands in D1 chart demonstrate active decrease. The price range is slightly expanded, trying to consolidate in the current range. MACD is growing keeping a weak buy signal (located above the signal line). Stochastic reversed upwards, having moved away from the level "20", which can be called a formal margin of oversold instrument.
There is a possibility of the uptrend in the short and/or ultra-short term.
Resistance levels: 1215.79, 1220.73, 1230.00, 1237.60.
Support levels: 1211.14, 1204.55, 1200.00.
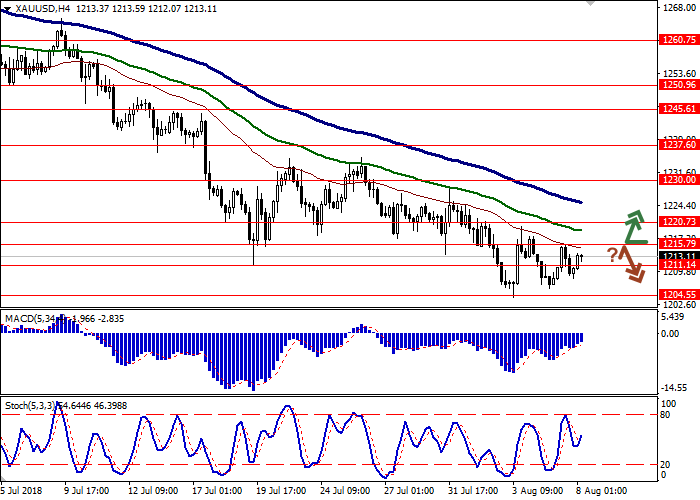

Trading tips
To open long positions one can rely on the breakout of 1215.79 or 1220.73, while maintaining "bullish" signals from technical indicators. Take profit — 1230.00 or 1233.00. Stop loss — 1213.00 or 1207.00.
The rebound from 1215.79 as from resistance with the subsequent breakdown of 1211.14 can become a signal to return to sales with target at 1200.00. Stop loss — 1218.00.
Implementation period: 2-3 days.
Gold prices showed a slight increase on Tuesday, partially offsetting the decline in quotations at the beginning of the week. The growth of the asset was facilitated by the decline in USD against certain instruments due to the approval of new US sanctions against Iran.
Additional support for gold was provided by the growth of the yuan, due to a certain decrease in the tension in the trade relations between the US and China.
Today, the instrument also is trading with a raise. Investors focus on the block of statistics on exports and imports from China. In July, exports rose by 12.2% YoY after growing by 11.2% YoY last month. Imports accelerated from +14.1% YoY to +27.3% YoY, which was significantly higher than forecasts (+16.2% YoY). Such a sharp increase in imports led to a reduction in the trade surplus from USD 41.47B to 28.05B.
Support and resistance
Bollinger Bands in D1 chart demonstrate active decrease. The price range is slightly expanded, trying to consolidate in the current range. MACD is growing keeping a weak buy signal (located above the signal line). Stochastic reversed upwards, having moved away from the level "20", which can be called a formal margin of oversold instrument.
There is a possibility of the uptrend in the short and/or ultra-short term.
Resistance levels: 1215.79, 1220.73, 1230.00, 1237.60.
Support levels: 1211.14, 1204.55, 1200.00.
Trading tips
To open long positions one can rely on the breakout of 1215.79 or 1220.73, while maintaining "bullish" signals from technical indicators. Take profit — 1230.00 or 1233.00. Stop loss — 1213.00 or 1207.00.
The rebound from 1215.79 as from resistance with the subsequent breakdown of 1211.14 can become a signal to return to sales with target at 1200.00. Stop loss — 1218.00.
Implementation period: 2-3 days.


No comments:
Write comments