
NZD/USD: the instrument is moving in different directions
08 August 2018, 10:15
| Scenario | |
|---|---|
| Timeframe | Intraday |
| Recommendation | BUY STOP |
| Entry Point | 0.6770 |
| Take Profit | 0.6800, 0.6833 |
| Stop Loss | 0.6730 |
| Key Levels | 0.6686, 0.6712, 0.6746, 0.6760, 0.6788, 0.6833, 0.6857 |
| Alternative scenario | |
|---|---|
| Recommendation | SELL STOP |
| Entry Point | 0.6705 |
| Take Profit | 0.6670, 0.6650 |
| Stop Loss | 0.6730 |
| Key Levels | 0.6686, 0.6712, 0.6746, 0.6760, 0.6788, 0.6833, 0.6857 |
Current trend
Yesterday, NZD did not change much against USD. The instrument was trading within an upward direction, but by the end of the afternoon session, it returned to the red zone. The investors are focused on the new US sanctions against Iran.
On Tuesday, the first part of the sanctions entered into force; the purchase of US treasuries by the Iranian government was restricted, as well as trade in gold, coal, steel, and aluminum. Automotive sector and sovereign debt were also sanctioned. All this has already led to the refusal of Daimler AG to expand sales of Mercedes cars in the Islamic Republic.
US President Donald Trump said that, along with economic pressure, he is ready to conclude a deal with Iran, if the latter suspends the programs for the development of ballistic missiles. However, the Iranian leader responded that, while sanctions are still in effect, no negotiation is possible.
Support and resistance
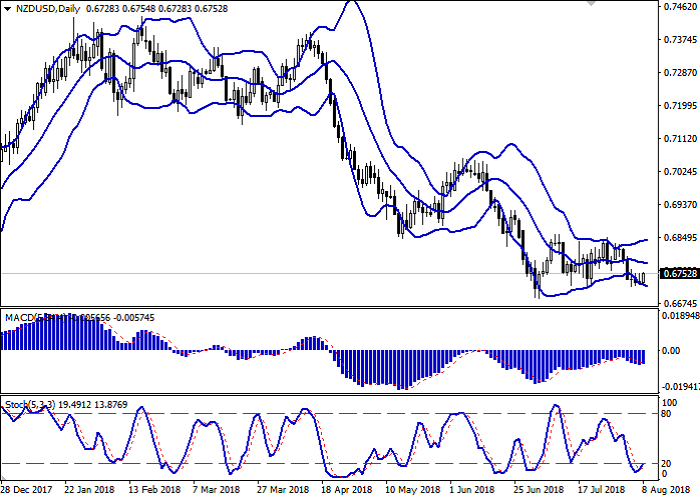
On the daily chart, Bollinger bands are moving flat. The price range expands, indicating a growing activity in the market. MACD tries to reverse upwards and generate a buy signal (the histogram should consolidate above the signal line). Stochastic reverses upwards, retreating from its lows, which show that NZD is oversold.
The indicators’ readings do not contradict the development of corrective growth in the short and/or ultra-short term.
Resistance levels: 0.6760, 0.6788, 0.6833, 0.6857.
Support levels: 0.6746, 0.6712, 0.6686.
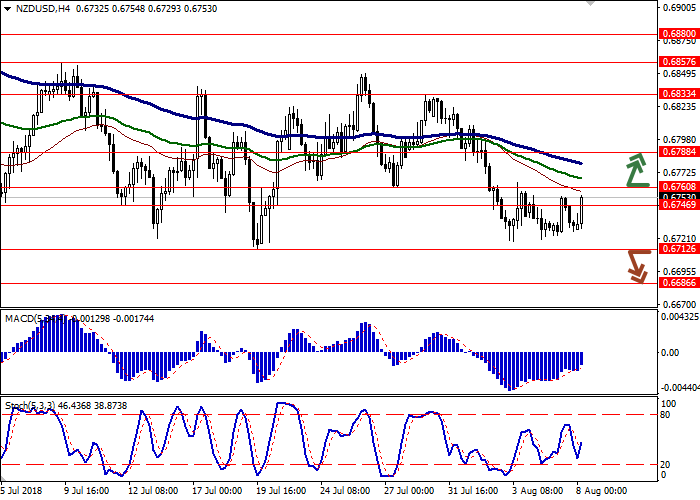
Trading tips
Long positions can be opened after the breakout of the level of 0.6760 with the targets at 0.6800–0.6833 and the stop loss 0.6730.
Short positions can be opened after the breakdown of the level of 0.6712 with the targets at 0.6670–0.6650 and stop loss 0.6730.
Implementation period: 2–3 days.
Yesterday, NZD did not change much against USD. The instrument was trading within an upward direction, but by the end of the afternoon session, it returned to the red zone. The investors are focused on the new US sanctions against Iran.
On Tuesday, the first part of the sanctions entered into force; the purchase of US treasuries by the Iranian government was restricted, as well as trade in gold, coal, steel, and aluminum. Automotive sector and sovereign debt were also sanctioned. All this has already led to the refusal of Daimler AG to expand sales of Mercedes cars in the Islamic Republic.
US President Donald Trump said that, along with economic pressure, he is ready to conclude a deal with Iran, if the latter suspends the programs for the development of ballistic missiles. However, the Iranian leader responded that, while sanctions are still in effect, no negotiation is possible.
Support and resistance
On the daily chart, Bollinger bands are moving flat. The price range expands, indicating a growing activity in the market. MACD tries to reverse upwards and generate a buy signal (the histogram should consolidate above the signal line). Stochastic reverses upwards, retreating from its lows, which show that NZD is oversold.
The indicators’ readings do not contradict the development of corrective growth in the short and/or ultra-short term.
Resistance levels: 0.6760, 0.6788, 0.6833, 0.6857.
Support levels: 0.6746, 0.6712, 0.6686.
Trading tips
Long positions can be opened after the breakout of the level of 0.6760 with the targets at 0.6800–0.6833 and the stop loss 0.6730.
Short positions can be opened after the breakdown of the level of 0.6712 with the targets at 0.6670–0.6650 and stop loss 0.6730.
Implementation period: 2–3 days.


No comments:
Write comments