
GBP/USD: the instrument is consolidating
08 August 2018, 10:09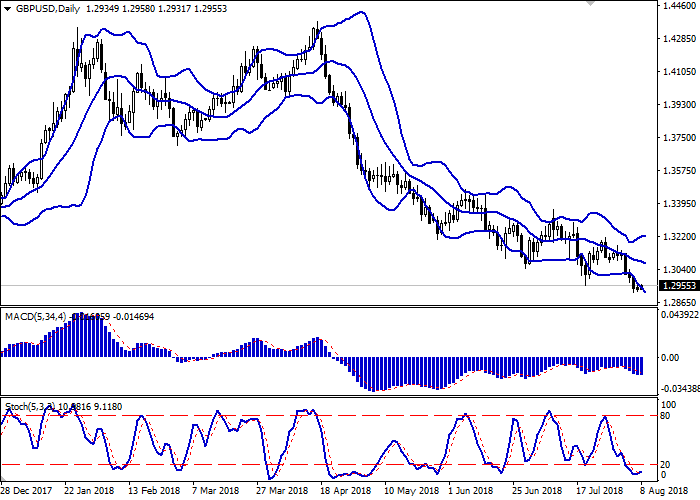
| Scenario | |
|---|---|
| Timeframe | Intraday |
| Recommendation | BUY STOP |
| Entry Point | 1.2985, 1.3005 |
| Take Profit | 1.3100, 1.3120 |
| Stop Loss | 1.2950, 1.2930 |
| Key Levels | 1.2850, 1.2900, 1.2956, 1.3000, 1.3048, 1.3100 |
| Alternative scenario | |
|---|---|
| Recommendation | SELL STOP |
| Entry Point | 1.2890 |
| Take Profit | 1.2800 |
| Stop Loss | 1.2950, 1.2956 |
| Key Levels | 1.2850, 1.2900, 1.2956, 1.3000, 1.3048, 1.3100 |
Current trend
GBP showed ambiguous dynamics of trading against USD on Tuesday, but failed to retreat from record lows that were updated earlier this week.
In addition to the permanent uncertainty with Brexit, the weak data on retail sales was pressuring GBP yesterday. According to the British Retail Consortium (BRC), retail sales in stores opened at least for a year increased only by 0.5%, and the indicator itself tends to decline for the second month in a row. In July, the reason for the decline in the indicator was hot weather, which forced people to refrain from visiting the stores.
The data on Halifax House Prices supported GBP moderately on Tuesday. In July, the index rose by 1.4% MoM after growing by 0.9% MoM a month earlier. Experts expected a much more moderate growth of 0.2% MoM. For 3 months YoY, the growth of the indicator was + 3.3% 3m/YoY, with a forecast of + 2.7% 3m/YoY.
Support and resistance
Bollinger Bands in D1 chart demonstrate a gradual decrease. The price range expands from below, making way for new local lows for the "bears". MACD is reversing upwards keeping a sell signal (located below the signal line). Stochastic, having reached its minimum levels, reversed to the horizontal plane, indicating the risks associated with the oversold pound.
There is a possibility of forming a full-scale correction of the instrument upwards.
Resistance levels: 1.2956, 1.3000, 1.3048, 1.3100.
Support levels: 1.2900, 1.2850.
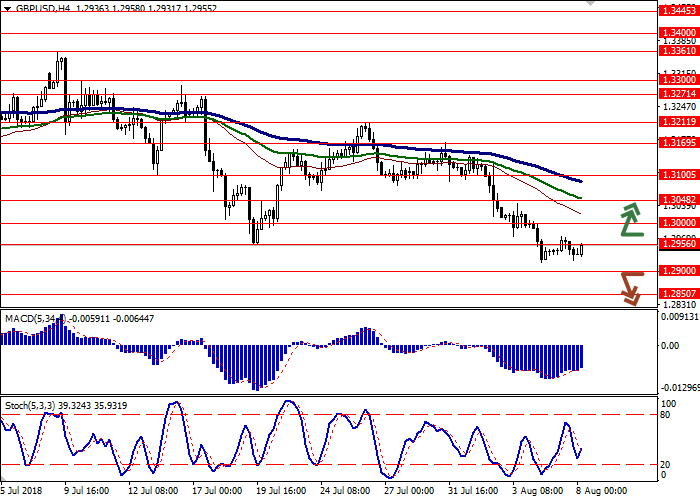

Trading tips
To open long positions, one can rely on the breakout of 1.2980 or 1.3000. Take profit — 1.3100 or 1.3120. Stop loss — 1.2950 or 1.2930.
The breakdown of 1.2900 may serve as a signal to further sales with the target at 1.2800. Stop loss — 1.2950 or 1.2956.
Implementation period: 2-3 days.
GBP showed ambiguous dynamics of trading against USD on Tuesday, but failed to retreat from record lows that were updated earlier this week.
In addition to the permanent uncertainty with Brexit, the weak data on retail sales was pressuring GBP yesterday. According to the British Retail Consortium (BRC), retail sales in stores opened at least for a year increased only by 0.5%, and the indicator itself tends to decline for the second month in a row. In July, the reason for the decline in the indicator was hot weather, which forced people to refrain from visiting the stores.
The data on Halifax House Prices supported GBP moderately on Tuesday. In July, the index rose by 1.4% MoM after growing by 0.9% MoM a month earlier. Experts expected a much more moderate growth of 0.2% MoM. For 3 months YoY, the growth of the indicator was + 3.3% 3m/YoY, with a forecast of + 2.7% 3m/YoY.
Support and resistance
Bollinger Bands in D1 chart demonstrate a gradual decrease. The price range expands from below, making way for new local lows for the "bears". MACD is reversing upwards keeping a sell signal (located below the signal line). Stochastic, having reached its minimum levels, reversed to the horizontal plane, indicating the risks associated with the oversold pound.
There is a possibility of forming a full-scale correction of the instrument upwards.
Resistance levels: 1.2956, 1.3000, 1.3048, 1.3100.
Support levels: 1.2900, 1.2850.
Trading tips
To open long positions, one can rely on the breakout of 1.2980 or 1.3000. Take profit — 1.3100 or 1.3120. Stop loss — 1.2950 or 1.2930.
The breakdown of 1.2900 may serve as a signal to further sales with the target at 1.2800. Stop loss — 1.2950 or 1.2956.
Implementation period: 2-3 days.


No comments:
Write comments