
XAG/USD: technical analysis
17 August 2018, 11:09
| Scenario | |
|---|---|
| Timeframe | Weekly |
| Recommendation | SELL LIMIT |
| Entry Point | 15.00 |
| Take Profit | 14.30, 13.95 |
| Stop Loss | 15.20 |
| Key Levels | 13.75, 13.95, 14.30, 15.00, 15.20, 15.60 |
| Alternative scenario | |
|---|---|
| Recommendation | BUY STOP |
| Entry Point | 15.20 |
| Take Profit | 15.60 |
| Stop Loss | 15.00 |
| Key Levels | 13.75, 13.95, 14.30, 15.00, 15.20, 15.60 |
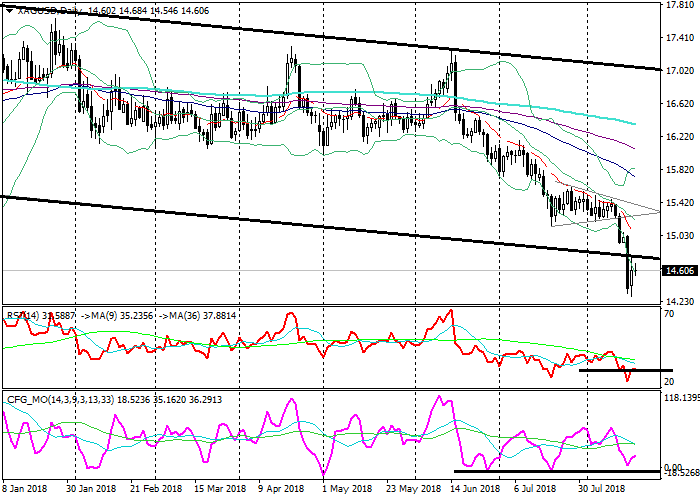
XAG/USD, D1
On the daily chart, the instrument is trading on the lower line of the Bollinger Bands. The price remains below its moving averages that are directed down. The RSI is testing from below the border of the oversold zone. The Composite is turning up, having retested its recent support.
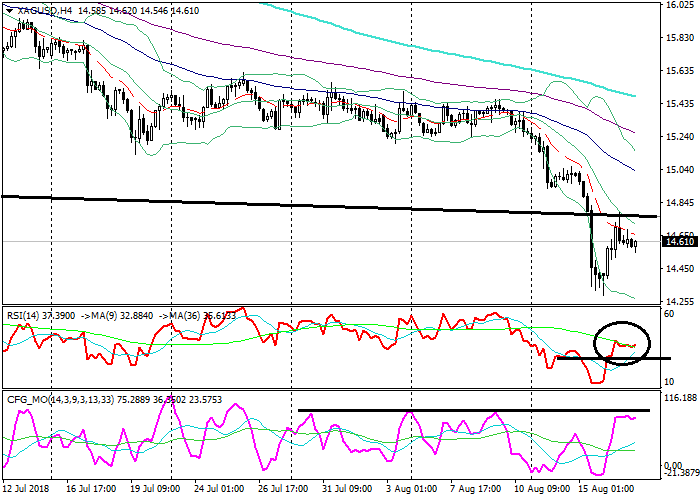
XAG/USD, H4
On the 4-hour chart, the instrument is trading in the lower Bollinger band. The price remains below its moving averages that are directed down. The RSI is testing from below its longer MA, having left the oversold zone. The Composite is testing its quite strong resistance.
Key levels
Support levels: 14.30 (local lows), 13.95 (August 2015 lows), 13.75 (January 2016 lows).
Resistance levels: 15.00 (local highs), 15.20 (local highs), 15.60 (December 2017 lows).
Trading tips
The price is consolidating below the lower border of its previous descending channel. The fall could continue.
Pending sell order can be placed at the level of 15.00 with targets at 14.30, 13.95 and stop-loss at 15.20. Validity – 3-5 days.
Long positions can be opened from the level of 15.20 with the target at 15.60 and stop-loss at 15.00. Validity – 3-5 days.
On the daily chart, the instrument is trading on the lower line of the Bollinger Bands. The price remains below its moving averages that are directed down. The RSI is testing from below the border of the oversold zone. The Composite is turning up, having retested its recent support.
XAG/USD, H4
On the 4-hour chart, the instrument is trading in the lower Bollinger band. The price remains below its moving averages that are directed down. The RSI is testing from below its longer MA, having left the oversold zone. The Composite is testing its quite strong resistance.
Key levels
Support levels: 14.30 (local lows), 13.95 (August 2015 lows), 13.75 (January 2016 lows).
Resistance levels: 15.00 (local highs), 15.20 (local highs), 15.60 (December 2017 lows).
Trading tips
The price is consolidating below the lower border of its previous descending channel. The fall could continue.
Pending sell order can be placed at the level of 15.00 with targets at 14.30, 13.95 and stop-loss at 15.20. Validity – 3-5 days.
Long positions can be opened from the level of 15.20 with the target at 15.60 and stop-loss at 15.00. Validity – 3-5 days.


No comments:
Write comments