
USD/JPY: pair in flat
17 August 2018, 10:47
| Scenario | |
|---|---|
| Timeframe | Intraday |
| Recommendation | BUY STOP |
| Entry Point | 111.20 |
| Take Profit | 112.00 |
| Stop Loss | 110.80 |
| Key Levels | 109.76, 110.00, 110.25, 110.54, 110.73, 111.16, 111.52, 111.85, 112.13 |
| Alternative scenario | |
|---|---|
| Recommendation | SELL STOP |
| Entry Point | 110.50 |
| Take Profit | 110.00, 109.76 |
| Stop Loss | 110.85, 111.00 |
| Key Levels | 109.76, 110.00, 110.25, 110.54, 110.73, 111.16, 111.52, 111.85, 112.13 |
Current trend
The US dollar rose slightly against the Japanese yen on Thursday, August 16, partially offsetting the sharp decline of the pair the day before. The corrective dynamics contributed to weak macroeconomic data from Japan.
Published on Thursday, data on Japan's trade balance were negative. In July, it showed a deficit of 231.2 billion yen. At the same time, the import index increased from 2.6% to 14.6%, while exports decreased from 6.7% to 3.9%. According to the Ministry of Finance, the trade balance deficit was formed due to rising energy prices and an increase in the supply of medical products and aircraft products to Japan.
In addition, investors drew attention to a significant reduction in investment in foreign bonds. Over the week of August 10, their volume fell from 1164 billion yen to 123.9 billion yen.
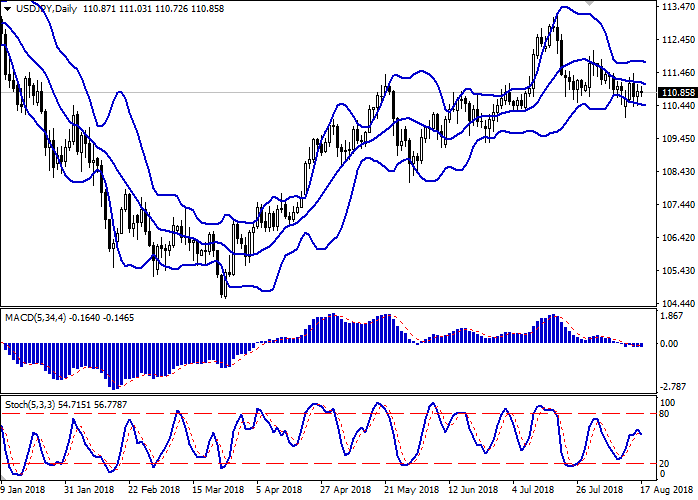
Support and resistance
Bollinger bands on the daily chart are directed downwards. The price range is slightly narrowed from above, reflecting the mixed nature of trading in recent days. The indicator MACD tries to turn upwards, keeping the former signal for sale (the histogram is located below the signal line). Stochastic turned down, reacting to a surge of «bearish» sentiment on Wednesday, August 15.
The current indications of technical indicators remain contradictory and do not form clear trade signals.
Resistance levels: 111.16, 111.52, 111.85, 112.13.
Support levels: 110.73, 110.54, 110.25, 110.00, 109.76.
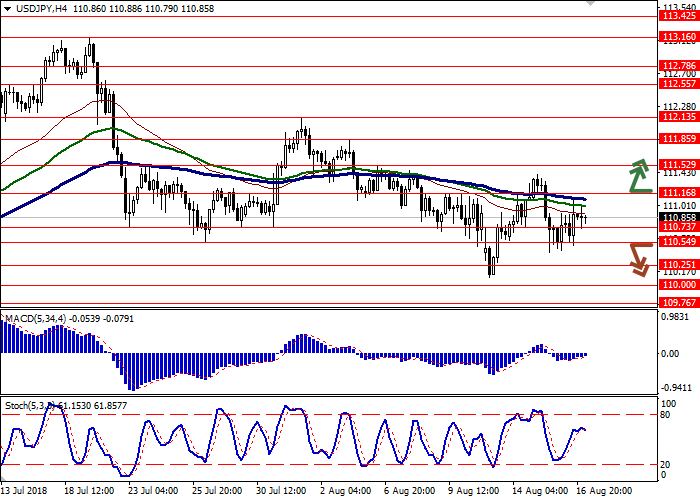
Trading tips
To open long positions, you can rely on the breakout of 111.16. Take profit – 112.00. Stop loss – 110.80. Term of realization: 2-3 days.
Breakdown of 110.54 can become a signal to sell with the targets of 110.00 and 109.76. The stop loss is 110.85 or 111.00. Term of realization: 2-3 days.
The US dollar rose slightly against the Japanese yen on Thursday, August 16, partially offsetting the sharp decline of the pair the day before. The corrective dynamics contributed to weak macroeconomic data from Japan.
Published on Thursday, data on Japan's trade balance were negative. In July, it showed a deficit of 231.2 billion yen. At the same time, the import index increased from 2.6% to 14.6%, while exports decreased from 6.7% to 3.9%. According to the Ministry of Finance, the trade balance deficit was formed due to rising energy prices and an increase in the supply of medical products and aircraft products to Japan.
In addition, investors drew attention to a significant reduction in investment in foreign bonds. Over the week of August 10, their volume fell from 1164 billion yen to 123.9 billion yen.
Support and resistance
Bollinger bands on the daily chart are directed downwards. The price range is slightly narrowed from above, reflecting the mixed nature of trading in recent days. The indicator MACD tries to turn upwards, keeping the former signal for sale (the histogram is located below the signal line). Stochastic turned down, reacting to a surge of «bearish» sentiment on Wednesday, August 15.
The current indications of technical indicators remain contradictory and do not form clear trade signals.
Resistance levels: 111.16, 111.52, 111.85, 112.13.
Support levels: 110.73, 110.54, 110.25, 110.00, 109.76.
Trading tips
To open long positions, you can rely on the breakout of 111.16. Take profit – 112.00. Stop loss – 110.80. Term of realization: 2-3 days.
Breakdown of 110.54 can become a signal to sell with the targets of 110.00 and 109.76. The stop loss is 110.85 or 111.00. Term of realization: 2-3 days.


No comments:
Write comments