
Mastercard Inc. (MA/NYSE): general review
17 August 2018, 11:17
| Scenario | |
|---|---|
| Timeframe | Intraday |
| Recommendation | BUY STOP |
| Entry Point | 205.10 |
| Take Profit | 209.00, 213.00, 215.00 |
| Stop Loss | 201.00 |
| Key Levels | 188.00, 193.00, 199.00, 205.00, 209.00, 214.00 |
| Alternative scenario | |
|---|---|
| Recommendation | SELL STOP |
| Entry Point | 198.90 |
| Take Profit | 193.00, 190.00 |
| Stop Loss | 203.00 |
| Key Levels | 188.00, 193.00, 199.00, 205.00, 209.00, 214.00 |
Current trend
The shares of Mastercard decreased by 4.91% after the publication of the results for the 4th quarter of the financial year 2018. The company's revenue increased by 18% YoY to $3.7 billion, net profit per share increased by 51% YoY to $1.66. Both indicators exceeded market expectations thanks to increased volume of payments by 50% YoY and successful expansion into the international market. Following the results of 2018 the profit growth is expected to increase by 40% in comparison with last year's numbers.
Over the past week, Mastercard shares rose by 0.05%. The S&P 500 index for the same period decreased by 0.46%.
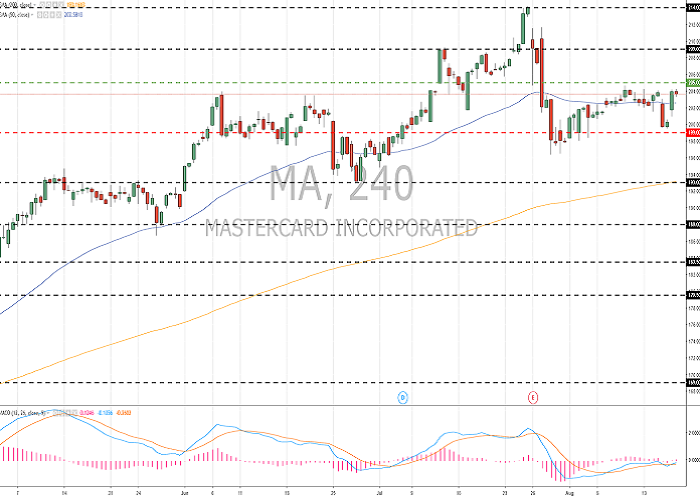
Support and resistance
The issuer is in sideways motion; unidirectional trend is not observed. The technical picture indicates a possible correction of the company's shares. Indicators do not give clear signals: the price crossed 50 MA; MACD histogram is located near the zero level.
A comparative analysis of the company's multipliers and competing companies in the industry testifies to the neutrality of #MA.
Support levels: 199.00, 193.00, 188.00.
Resistance levels: 205.00, 209.00, 214.00.
Trading tips
If the price goes above the resistance level of 205.00, long positions will become relevant. The potential profit levels are 209.00, 213.00 and 215.00. Stop loss – 201.00.
If the price consolidates below the support level of 199.00, correction movement is expected. The potential profit zone would be 193.00-190.00. Stop loss can be set at 203.00.
Trading scenarios will be relevant for 3 days.
The shares of Mastercard decreased by 4.91% after the publication of the results for the 4th quarter of the financial year 2018. The company's revenue increased by 18% YoY to $3.7 billion, net profit per share increased by 51% YoY to $1.66. Both indicators exceeded market expectations thanks to increased volume of payments by 50% YoY and successful expansion into the international market. Following the results of 2018 the profit growth is expected to increase by 40% in comparison with last year's numbers.
Over the past week, Mastercard shares rose by 0.05%. The S&P 500 index for the same period decreased by 0.46%.
Support and resistance
The issuer is in sideways motion; unidirectional trend is not observed. The technical picture indicates a possible correction of the company's shares. Indicators do not give clear signals: the price crossed 50 MA; MACD histogram is located near the zero level.
A comparative analysis of the company's multipliers and competing companies in the industry testifies to the neutrality of #MA.
Support levels: 199.00, 193.00, 188.00.
Resistance levels: 205.00, 209.00, 214.00.
Trading tips
If the price goes above the resistance level of 205.00, long positions will become relevant. The potential profit levels are 209.00, 213.00 and 215.00. Stop loss – 201.00.
If the price consolidates below the support level of 199.00, correction movement is expected. The potential profit zone would be 193.00-190.00. Stop loss can be set at 203.00.
Trading scenarios will be relevant for 3 days.


No comments:
Write comments