
WTI Crude Oil: general analysis
13 August 2018, 14:30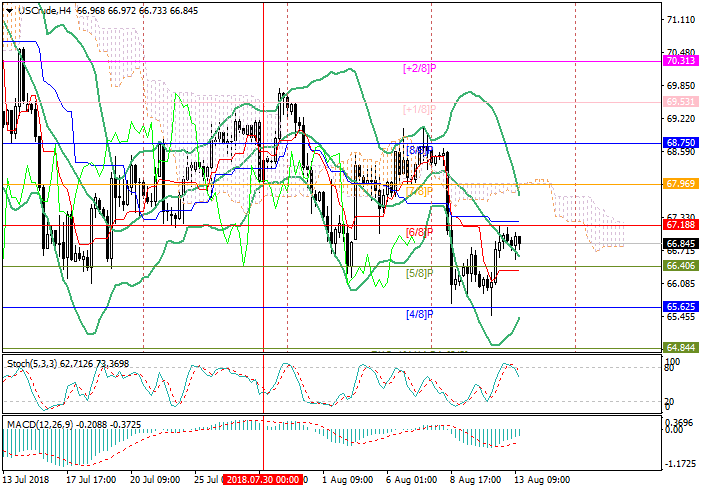
| Scenario | |
|---|---|
| Timeframe | Weekly |
| Recommendation | SELL STOP |
| Entry Point | 66.35 |
| Take Profit | 65.62, 64.84 |
| Stop Loss | 66.80 |
| Key Levels | 64.84, 65.62, 66.40, 67.18, 67.96, 68.75 |
| Alternative scenario | |
|---|---|
| Recommendation | BUY STOP |
| Entry Point | 67.18 |
| Take Profit | 67.96, 68.75 |
| Stop Loss | 66.90 |
| Key Levels | 64.84, 65.62, 66.40, 67.18, 67.96, 68.75 |
Current trend
Today, oil is trading around 67.00, Friday's growth has stopped.
The traders are focused on the US anti-Iraqi sanctions. At the end of last week, Iranian Foreign Minister Javad Zarif said that there is no meeting with US officials planned in the near future, including the UN General Assembly to be held next month. The entry into force of US sanctions against the Iranian oil sector is scheduled for November 5. Refusal of dialogue means a continuation of the pressure of the USA on the importer countries to make them refuse of the Iranian oil? Which failed with China and Russia, but France and South Korea stopped cooperating with the Islamic Republic.
Last year, Iran exported about 2.1 million barrels of oil per day. Probably, the flow will not be completely blocked, however, the US administration expects to reduce supplies by 0.7–1.0 million barrels per day.
Support and resistance
At present, the key "bullish" level is 67.18 (Murrey [6/8]). In case of breakout, the price may rise to the levels of 67.96 (Murrey [7/8]) and 68.75 (Murrey [8/8]). However, according to the reversal of the Bollinger Bands and Stochastic downwards, the price is more likely to fall to 65.62 (Murrey [4/8]) and 64.84 (Murrey [3/8]) after the breakdown of the level of 66.40 in the mid-range of Bollinger bands.
Resistance levels: 67.18, 67.96, 68.75.
Support levels: 66.40, 65.62, 64.84.

Trading tips
Short positions can be opened below the level of 66.40 with the targets at 65.62, 64.84 and stop loss 66.80.
Long positions can be opened above the level of 67.18 with the targets at 67.96, 68.75 and stop loss around 66.90.
Implementation period: 3–5 days.
Today, oil is trading around 67.00, Friday's growth has stopped.
The traders are focused on the US anti-Iraqi sanctions. At the end of last week, Iranian Foreign Minister Javad Zarif said that there is no meeting with US officials planned in the near future, including the UN General Assembly to be held next month. The entry into force of US sanctions against the Iranian oil sector is scheduled for November 5. Refusal of dialogue means a continuation of the pressure of the USA on the importer countries to make them refuse of the Iranian oil? Which failed with China and Russia, but France and South Korea stopped cooperating with the Islamic Republic.
Last year, Iran exported about 2.1 million barrels of oil per day. Probably, the flow will not be completely blocked, however, the US administration expects to reduce supplies by 0.7–1.0 million barrels per day.
Support and resistance
At present, the key "bullish" level is 67.18 (Murrey [6/8]). In case of breakout, the price may rise to the levels of 67.96 (Murrey [7/8]) and 68.75 (Murrey [8/8]). However, according to the reversal of the Bollinger Bands and Stochastic downwards, the price is more likely to fall to 65.62 (Murrey [4/8]) and 64.84 (Murrey [3/8]) after the breakdown of the level of 66.40 in the mid-range of Bollinger bands.
Resistance levels: 67.18, 67.96, 68.75.
Support levels: 66.40, 65.62, 64.84.
Trading tips
Short positions can be opened below the level of 66.40 with the targets at 65.62, 64.84 and stop loss 66.80.
Long positions can be opened above the level of 67.18 with the targets at 67.96, 68.75 and stop loss around 66.90.
Implementation period: 3–5 days.


No comments:
Write comments