
Netflix, Inc. (NFLX/NASD): general review
13 August 2018, 14:05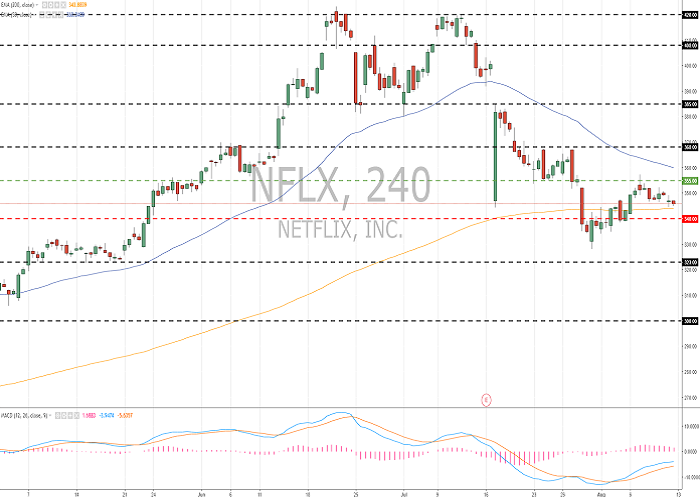
| Scenario | |
|---|---|
| Timeframe | Intraday |
| Recommendation | SELL STOP |
| Entry Point | 339.90 |
| Take Profit | 330.00, 320.00, 315.00 |
| Stop Loss | 350.00 |
| Key Levels | 300.00, 323.00, 340.00, 355.00, 368.00, 385.00 |
| Alternative scenario | |
|---|---|
| Recommendation | BUY STOP |
| Entry Point | 355.10 |
| Take Profit | 370.00, 380.00 |
| Stop Loss | 345.00 |
| Key Levels | 300.00, 323.00, 340.00, 355.00, 368.00, 385.00 |
Current trend
Netflix shares lost 13.60% of the value after the publication on July 16th of mixed financial results for the 2nd quarter of 2018. The company's profit exceeded Wall Street's expectations by 7%, while the number of new subscribers following the results of the second quarter and revenue forecast for the third quarter were below market expectations, which puts pressure on the issuer's quotes. Nevertheless, in 2018 Netflix still forecasts a double increase in profits and a 36% increase in revenue.
Over the past week, Netflix shares rose by 0.81%. The S&P 500 index for the same period fell by 0.25%.
Support and resistance
Quotations of #NFLX are testing local support and resistance levels: 340.00 and 355.00, respectively. Indicators do not give clear signals: the price is fixed between 50 MA and 200 MA; The MACD histogram is located in the positive zone. A comparative analysis of the company's multipliers and competing companies in the industry testifies to the neutrality of #NFLX.
Support levels: 340.00, 323.00, 300.00.
Resistance levels: 355.00, 368.00, 385.00.

Trading tips
If the price goes below the support level of 340.00, further correction of #NFLX is expected. The potential profit levels are 330.00, 320.00 and 315.00. The stop loss will be at 350.00.
If the price consolidates above the level of 355.00, long positions will become relevant. The zone of potential profit is 370.00-380.00. Stop loss is 345.00.
Trading scenarios will be relevant for 3 days.
Netflix shares lost 13.60% of the value after the publication on July 16th of mixed financial results for the 2nd quarter of 2018. The company's profit exceeded Wall Street's expectations by 7%, while the number of new subscribers following the results of the second quarter and revenue forecast for the third quarter were below market expectations, which puts pressure on the issuer's quotes. Nevertheless, in 2018 Netflix still forecasts a double increase in profits and a 36% increase in revenue.
Over the past week, Netflix shares rose by 0.81%. The S&P 500 index for the same period fell by 0.25%.
Support and resistance
Quotations of #NFLX are testing local support and resistance levels: 340.00 and 355.00, respectively. Indicators do not give clear signals: the price is fixed between 50 MA and 200 MA; The MACD histogram is located in the positive zone. A comparative analysis of the company's multipliers and competing companies in the industry testifies to the neutrality of #NFLX.
Support levels: 340.00, 323.00, 300.00.
Resistance levels: 355.00, 368.00, 385.00.
Trading tips
If the price goes below the support level of 340.00, further correction of #NFLX is expected. The potential profit levels are 330.00, 320.00 and 315.00. The stop loss will be at 350.00.
If the price consolidates above the level of 355.00, long positions will become relevant. The zone of potential profit is 370.00-380.00. Stop loss is 345.00.
Trading scenarios will be relevant for 3 days.


No comments:
Write comments