
eBay Inc. (EBAY/NASD): general analysis
13 August 2018, 13:50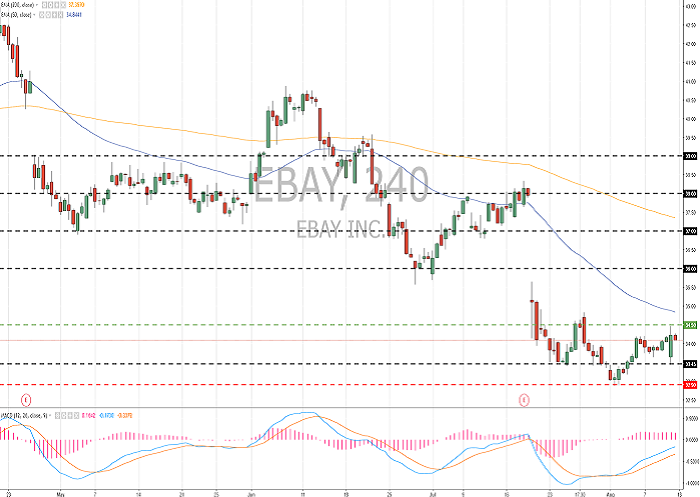
| Scenario | |
|---|---|
| Timeframe | Intraday |
| Recommendation | BUY STOP |
| Entry Point | 34.55 |
| Take Profit | 35.50, 36.50, 37.00 |
| Stop Loss | 33.50 |
| Key Levels | 32.00, 32.90, 33.45, 34.50, 36.00, 37.00 |
| Alternative scenario | |
|---|---|
| Recommendation | SELL STOP |
| Entry Point | 32.80 |
| Take Profit | 31.00, 30.50 |
| Stop Loss | 33.90 |
| Key Levels | 32.00, 32.90, 33.45, 34.50, 36.00, 37.00 |
Current trend
After the publication of the quarterly results on July 18, eBay shares are traded near the 52-week minimum, losing more than 10%. Despite the increase in net profit per share by 17.7% YoY to $0.53 and revenue by 9.1 %% YoY to $2.64 bln, both figures were below expectations of Wall Street. The shares were under additional pressure due to a decline in revenue forecast for 2018 to 10.75–10.85 from a previously announced forecast of 10.9–11.1 bln USD.
During the last week, eBay rose 1.28% against the decrease of the S&P 500 index by 0.25%.
Support and resistance
At the moment, the company's shares are consolidating. The technical picture reflects a possible correction after a prolonged fall. Local support and resistance are 33.45 and 34.50. The signals of the indicators are ambiguous: the price was fixed below MA (50) and MA (200); MACD histogram is in the positive zone. It is better to open the positions from the key levels.
The comparative analysis of the indicators of the company and its competitors suggests that its shares are underpriced.
Resistance levels: 34.50, 36.00, 37.00.
Support levels: 33.45, 32.90, 32.00.

Trading tips
Long positions can be opened after the price is set above the level of 34.50. The closing of the profitable positions is possible at the levels of 35.50, 36.50 and 37.00. Stop loss is 33.50.
Short positions can be opened after the price is set below the level of 32.90 with the targets at 31.00–30.50 and the stop loss 33.90.
Implementation period: 3 days.
After the publication of the quarterly results on July 18, eBay shares are traded near the 52-week minimum, losing more than 10%. Despite the increase in net profit per share by 17.7% YoY to $0.53 and revenue by 9.1 %% YoY to $2.64 bln, both figures were below expectations of Wall Street. The shares were under additional pressure due to a decline in revenue forecast for 2018 to 10.75–10.85 from a previously announced forecast of 10.9–11.1 bln USD.
During the last week, eBay rose 1.28% against the decrease of the S&P 500 index by 0.25%.
Support and resistance
At the moment, the company's shares are consolidating. The technical picture reflects a possible correction after a prolonged fall. Local support and resistance are 33.45 and 34.50. The signals of the indicators are ambiguous: the price was fixed below MA (50) and MA (200); MACD histogram is in the positive zone. It is better to open the positions from the key levels.
The comparative analysis of the indicators of the company and its competitors suggests that its shares are underpriced.
Resistance levels: 34.50, 36.00, 37.00.
Support levels: 33.45, 32.90, 32.00.
Trading tips
Long positions can be opened after the price is set above the level of 34.50. The closing of the profitable positions is possible at the levels of 35.50, 36.50 and 37.00. Stop loss is 33.50.
Short positions can be opened after the price is set below the level of 32.90 with the targets at 31.00–30.50 and the stop loss 33.90.
Implementation period: 3 days.


No comments:
Write comments