
USD/JPY: the dollar is falling
09 August 2018, 10:28
| Scenario | |
|---|---|
| Timeframe | Intraday |
| Recommendation | BUY STOP |
| Entry Point | 111.10, 111.15 |
| Take Profit | 111.85 |
| Stop Loss | 110.60 |
| Key Levels | 110.25, 110.54, 110.73, 111.08, 111.52, 111.85, 112.13 |
| Alternative scenario | |
|---|---|
| Recommendation | SELL STOP |
| Entry Point | 110.65 |
| Take Profit | 110.25, 110.00 |
| Stop Loss | 111.10 |
| Key Levels | 110.25, 110.54, 110.73, 111.08, 111.52, 111.85, 112.13 |
Current trend
Yesterday, USD fell against JPY, renewing local minimum since July 31.
Investors are focused on the US-China trade war. Since August 23, the US administration is preparing to introduce a 25% tariff for an additional 279 Chinese goods worth a total of USD 16 billion. Earlier it was assumed that increased tariffs on Chinese goods totaling USD 200 billion will be implemented on August 30, but, apparently, a new round of trade tension will begin earlier. July PRC's statistics were ambiguous. Trade Balance decreased from 41.47 billion USD to 28.05 billion. Import increased by 27.3%, and exports grew by 12.2% due to a serious weakening of the yuan.
Generally, investors prepare for Friday, when the July CPI will be published. The indicators are expected to stay at the levels of 2.9% (CPI) and 2.3% (base CPI).
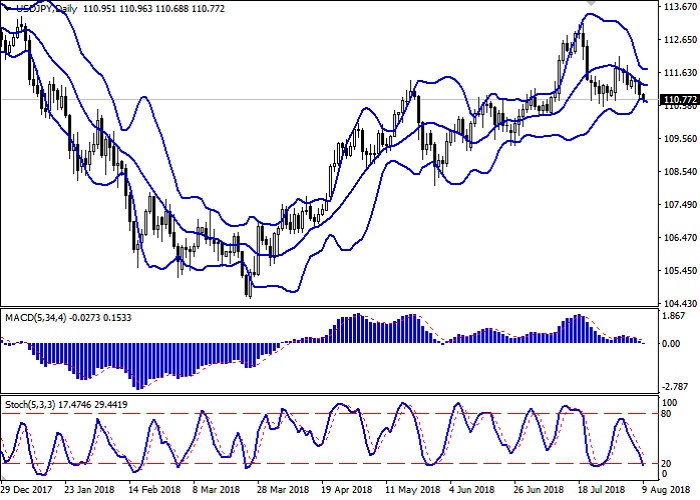
Support and resistance
On the daily chart, Bollinger bands are moving in flat. The price range is slightly widening from below, letting the "bears" renew record lows. MACD declines, keeping a strong sell signal (the histogram is below the signal line), and tries to consolidate below the zero line. Stochastic is pointing down but is approaching its lows, reflecting that USD can become oversold.
Current indicators’ readings do not contradict the further development of the "bearish" trend in the short term.
Resistance levels: 111.08, 111.52, 111.85, 112.13.
Support levels: 110.73, 110.54, 110.25.
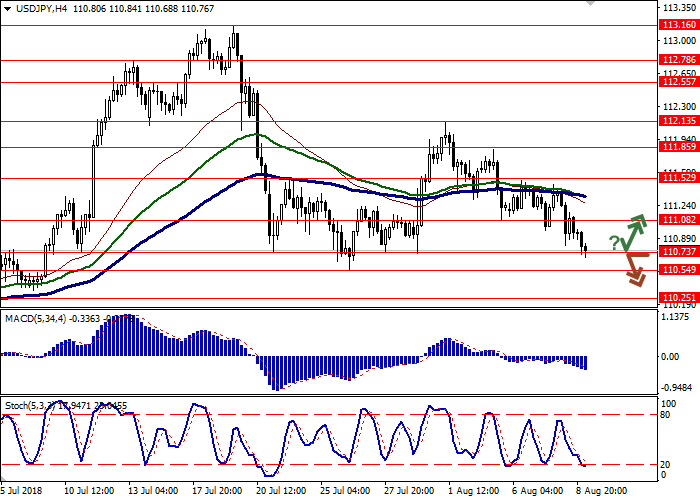
Trading tips
Long positions can be opened after the rebound from the level of 110.73 and the breakout of levels 111.00–111.08 with the target at 111.85. Stop loss is 110.60.
Short positions can be opened after the breakdown of the level of 110.73 with the targets at 110.25–110.00. Stop loss is 111.10.
Implementation period: 2–3 days.
Yesterday, USD fell against JPY, renewing local minimum since July 31.
Investors are focused on the US-China trade war. Since August 23, the US administration is preparing to introduce a 25% tariff for an additional 279 Chinese goods worth a total of USD 16 billion. Earlier it was assumed that increased tariffs on Chinese goods totaling USD 200 billion will be implemented on August 30, but, apparently, a new round of trade tension will begin earlier. July PRC's statistics were ambiguous. Trade Balance decreased from 41.47 billion USD to 28.05 billion. Import increased by 27.3%, and exports grew by 12.2% due to a serious weakening of the yuan.
Generally, investors prepare for Friday, when the July CPI will be published. The indicators are expected to stay at the levels of 2.9% (CPI) and 2.3% (base CPI).
Support and resistance
On the daily chart, Bollinger bands are moving in flat. The price range is slightly widening from below, letting the "bears" renew record lows. MACD declines, keeping a strong sell signal (the histogram is below the signal line), and tries to consolidate below the zero line. Stochastic is pointing down but is approaching its lows, reflecting that USD can become oversold.
Current indicators’ readings do not contradict the further development of the "bearish" trend in the short term.
Resistance levels: 111.08, 111.52, 111.85, 112.13.
Support levels: 110.73, 110.54, 110.25.
Trading tips
Long positions can be opened after the rebound from the level of 110.73 and the breakout of levels 111.00–111.08 with the target at 111.85. Stop loss is 110.60.
Short positions can be opened after the breakdown of the level of 110.73 with the targets at 110.25–110.00. Stop loss is 111.10.
Implementation period: 2–3 days.


No comments:
Write comments