
XAG/USD: silver prices are growing moderately
09 August 2018, 10:44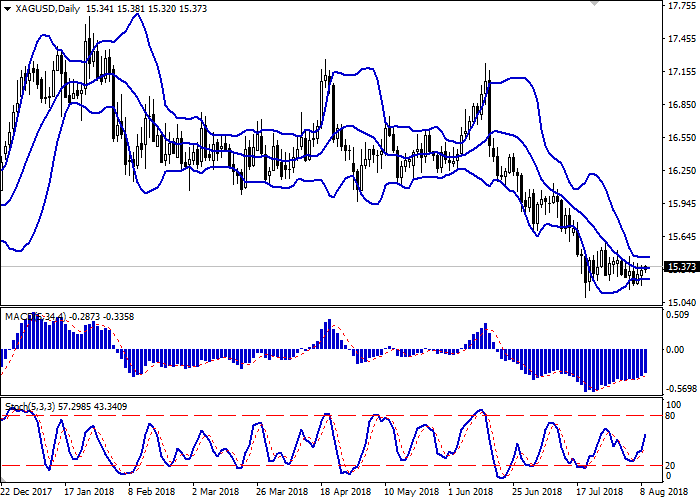
| Scenario | |
|---|---|
| Timeframe | Intraday |
| Recommendation | BUY STOP |
| Entry Point | 15.50 |
| Take Profit | 15.60, 15.70 |
| Stop Loss | 15.30 |
| Key Levels | 15.09, 15.15, 15.24, 15.30, 15.44, 15.51, 15.60 |
| Alternative scenario | |
|---|---|
| Recommendation | SELL STOP |
| Entry Point | 15.20 |
| Take Profit | 15.00, 14.90 |
| Stop Loss | 15.35 |
| Key Levels | 15.09, 15.15, 15.24, 15.30, 15.44, 15.51, 15.60 |
Current trend
Prices for silver grew on Wednesday, but failed to rise above the local highs of Tuesday. A more active uptrend on the instrument is hampered by expectations of a further increase in the Fed interest rates, as well as high demand for US Treasury bonds.
Yet another aggravation of trade relations between the US and China continues to provide moderate support to the instrument. In late August, the US intends to introduce additional duties on Chinese goods totaling USD 16 billion.
Generally, investors are beginning to prepare for Friday, when the July data on the consumer price index will be published. According to forecasts, the indicators will remain the same — 2.9% for the CPI and 2.3% for the core CPI.
Support and resistance
Bollinger Bands in D1 chart demonstrate flat dynamics. The price range has been consolidated in a rather narrow range for a few days, which indicates the ambiguous nature of trading in the short term. MACD indicator is growing keeping a stable buy signal (located above the signal line). Stochastic keeps a confident upward direction and is approaching its maximum levels rapidly. Nevertheless, current indicators do not contradict the current growth of the silver quotations.
One should consider buying in the short and/or ultra-short term before the emergence of contradictory signals.
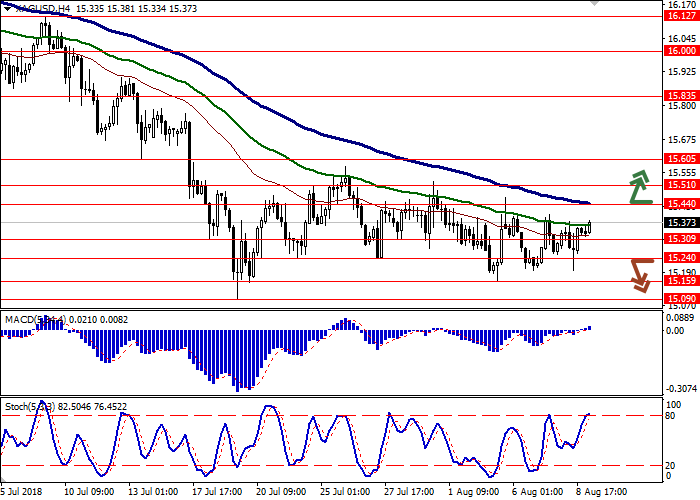
Resistance levels: 15.44, 15.51, 15.60.
Support levels: 15.30, 15.24, 15.15, 15.09.

Trading tips
To open long positions one can rely on the breakout of 15.44, while maintaining "bullish" signals from technical indicators. Take profit — 15.60 or 15.70. Stop loss — 15.32 or 15.30.
The return of "bearish" trend with the breakdown of 15.24 may become a signal for new sales with the target at 15.00 or 14.90. Stop loss — 15.35.
Implementation period: 2-3 days.
Prices for silver grew on Wednesday, but failed to rise above the local highs of Tuesday. A more active uptrend on the instrument is hampered by expectations of a further increase in the Fed interest rates, as well as high demand for US Treasury bonds.
Yet another aggravation of trade relations between the US and China continues to provide moderate support to the instrument. In late August, the US intends to introduce additional duties on Chinese goods totaling USD 16 billion.
Generally, investors are beginning to prepare for Friday, when the July data on the consumer price index will be published. According to forecasts, the indicators will remain the same — 2.9% for the CPI and 2.3% for the core CPI.
Support and resistance
Bollinger Bands in D1 chart demonstrate flat dynamics. The price range has been consolidated in a rather narrow range for a few days, which indicates the ambiguous nature of trading in the short term. MACD indicator is growing keeping a stable buy signal (located above the signal line). Stochastic keeps a confident upward direction and is approaching its maximum levels rapidly. Nevertheless, current indicators do not contradict the current growth of the silver quotations.
One should consider buying in the short and/or ultra-short term before the emergence of contradictory signals.
Resistance levels: 15.44, 15.51, 15.60.
Support levels: 15.30, 15.24, 15.15, 15.09.
Trading tips
To open long positions one can rely on the breakout of 15.44, while maintaining "bullish" signals from technical indicators. Take profit — 15.60 or 15.70. Stop loss — 15.32 or 15.30.
The return of "bearish" trend with the breakdown of 15.24 may become a signal for new sales with the target at 15.00 or 14.90. Stop loss — 15.35.
Implementation period: 2-3 days.


No comments:
Write comments