
USD/CAD: the pair returned to the flat dynamics
09 August 2018, 10:18
| Scenario | |
|---|---|
| Timeframe | Intraday |
| Recommendation | BUY STOP |
| Entry Point | 1.3040 |
| Take Profit | 1.3100, 1.3130 |
| Stop Loss | 1.2980 |
| Key Levels | 1.2900, 1.2961, 1.3000, 1.3061, 1.3100, 1.3156, 1.3200 |
| Alternative scenario | |
|---|---|
| Recommendation | SELL STOP |
| Entry Point | 1.2990 |
| Take Profit | 1.2900 |
| Stop Loss | 1.3050 |
| Key Levels | 1.2900, 1.2961, 1.3000, 1.3061, 1.3100, 1.3156, 1.3200 |
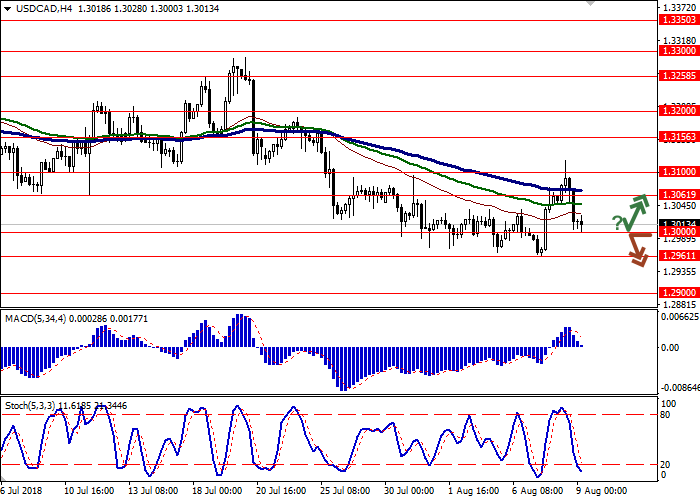
Current trend
USD declined against CAD on Wednesday, despite the fact that during the day the instrument was updating local highs of July 25. The pressure on the instrument was provided by the fear of deepening of the trade conflict between the US and China.
On August 23, the US administration is preparing to introduce additional duties on 279 Chinese goods for a total of USD 16 billion.
Today, the pair is trading in both directions, waiting for the appearance of new drivers at the market. The focus is on Friday publications, when the US will release statistics on consumer inflation, and Canada will publish the July report on the labor market. On Thursday, the release of Canadian data on real estate market is expected. In the US, data on the producer price index and initial jobless claims are expected to be released.
Support and resistance
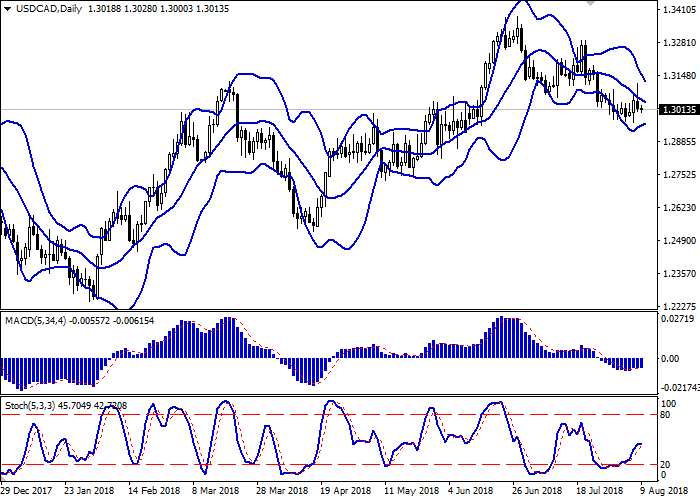
Bollinger Bands in D1 chart demonstrate a stable decrease. The price range is narrowing, reflecting ambiguous nature of trading in recent days. MACD is growing keeping a weak buy signal (located above the signal line). Stochastic reversed horizontally approximately at the center of its area, pointing to the balance of power in the ultra-short term.
It is necessary to wait for emergence of new trade signals from technical indicators.
Resistance levels: 1.3061, 1.3100, 1.3156, 1.3200.
Support levels: 1.3000, 1.2961, 1.2900.
Trading tips
To open long positions, one can rely on the rebound from the support level of 1.3000 with the subsequent breakout of 1.3030. Take profit — 1.3100 or 1.3130. Stop loss — 1.2980.
The breakdown of 1.3000 may serve as a signal to further sales with the target at 1.2900. Stop loss — 1.3050.
Implementation period: 2-3 days.
USD declined against CAD on Wednesday, despite the fact that during the day the instrument was updating local highs of July 25. The pressure on the instrument was provided by the fear of deepening of the trade conflict between the US and China.
On August 23, the US administration is preparing to introduce additional duties on 279 Chinese goods for a total of USD 16 billion.
Today, the pair is trading in both directions, waiting for the appearance of new drivers at the market. The focus is on Friday publications, when the US will release statistics on consumer inflation, and Canada will publish the July report on the labor market. On Thursday, the release of Canadian data on real estate market is expected. In the US, data on the producer price index and initial jobless claims are expected to be released.
Support and resistance
Bollinger Bands in D1 chart demonstrate a stable decrease. The price range is narrowing, reflecting ambiguous nature of trading in recent days. MACD is growing keeping a weak buy signal (located above the signal line). Stochastic reversed horizontally approximately at the center of its area, pointing to the balance of power in the ultra-short term.
It is necessary to wait for emergence of new trade signals from technical indicators.
Resistance levels: 1.3061, 1.3100, 1.3156, 1.3200.
Support levels: 1.3000, 1.2961, 1.2900.
Trading tips
To open long positions, one can rely on the rebound from the support level of 1.3000 with the subsequent breakout of 1.3030. Take profit — 1.3100 or 1.3130. Stop loss — 1.2980.
The breakdown of 1.3000 may serve as a signal to further sales with the target at 1.2900. Stop loss — 1.3050.
Implementation period: 2-3 days.


No comments:
Write comments