
USD/CHF: the instrument is consolidating
20 August 2018, 10:27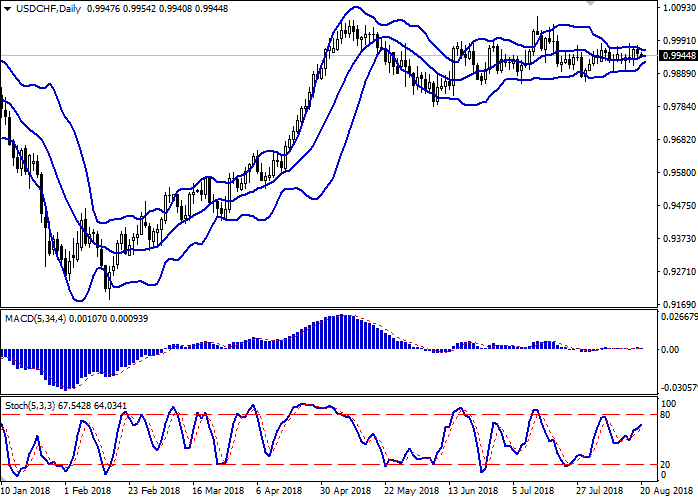
| Scenario | |
|---|---|
| Timeframe | Intraday |
| Recommendation | BUY STOP |
| Entry Point | 0.9975, 0.9985 |
| Take Profit | 1.0020, 1.0032 |
| Stop Loss | 0.9955 |
| Key Levels | 0.9863, 0.9892, 0.9918, 0.9952, 0.9982, 1.0000, 1.0032 |
| Alternative scenario | |
|---|---|
| Recommendation | SELL STOP |
| Entry Point | 0.9920, 0.9910 |
| Take Profit | 0.9880, 0.9863 |
| Stop Loss | 0.9945 |
| Key Levels | 0.9863, 0.9892, 0.9918, 0.9952, 0.9982, 1.0000, 1.0032 |
Current trend
USD showed a moderate decline against CHF on August 17, being pressured by corrective sentiments and quick profits fixing.
Investors continue to monitor global trade and geopolitics. In response to the increase in duties on American goods by Turkey and the refusal to release the arrested US pastor Andrew Brunson, US Treasury Secretary Stephen Mnuchin said that the US is ready to impose stronger sanctions against Turkey, after which the lira began to weaken again. Regarding the upcoming US-China trade negotiations, the US administration sends conflicting signals. On the one hand, President Trump's economic adviser, Larry Kudlow, welcomed them, believing that the discussion could yield good results. On the other hand, President Trump himself noted that the PRC government cannot offer the US an acceptable agreement, which means continued mutual tariff pressures.
Recall that the negotiations should be held on August 21-22, and already on August 23, new import duties will come into effect.
Support and resistance
Bollinger Bands in D1 chart demonstrate flat dynamics. The price range narrows, remaining very uncomfortable for the development of trend structures. The MACD indicator stretches along the zero line, indicating a long flat period, which persists since the beginning of August. Stochastic grows, quickly approaching its maximum marks.
Technical indicators remain uninformative, so one should wait for new trade signals to appear.
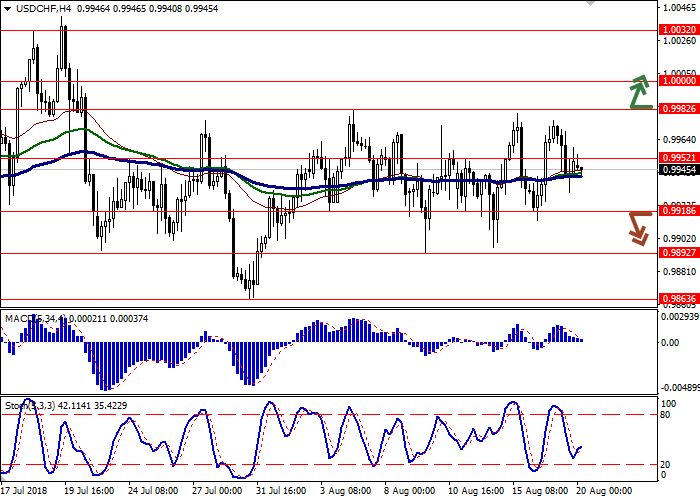
Resistance levels: 0.9952, 0.9982, 1.0000, 1.0032.
Support levels: 0.9918, 0.9892, 0.9863.

Trading tips
To open long positions, one can rely on the breakout of 0.9970-0.9982 when appropriate signals from the technical indicators appear. Take-profit — 1.0020-1.0032. Stop loss – 0.9955. Implementation time: 2-3 days.
The breakdown of 0.9925-0.9918 may serve as a signal to the beginning of sales with the target at 0.9880 or 0.9863. Stop loss – 0.9945. Implementation time: 2-3 days.
USD showed a moderate decline against CHF on August 17, being pressured by corrective sentiments and quick profits fixing.
Investors continue to monitor global trade and geopolitics. In response to the increase in duties on American goods by Turkey and the refusal to release the arrested US pastor Andrew Brunson, US Treasury Secretary Stephen Mnuchin said that the US is ready to impose stronger sanctions against Turkey, after which the lira began to weaken again. Regarding the upcoming US-China trade negotiations, the US administration sends conflicting signals. On the one hand, President Trump's economic adviser, Larry Kudlow, welcomed them, believing that the discussion could yield good results. On the other hand, President Trump himself noted that the PRC government cannot offer the US an acceptable agreement, which means continued mutual tariff pressures.
Recall that the negotiations should be held on August 21-22, and already on August 23, new import duties will come into effect.
Support and resistance
Bollinger Bands in D1 chart demonstrate flat dynamics. The price range narrows, remaining very uncomfortable for the development of trend structures. The MACD indicator stretches along the zero line, indicating a long flat period, which persists since the beginning of August. Stochastic grows, quickly approaching its maximum marks.
Technical indicators remain uninformative, so one should wait for new trade signals to appear.
Resistance levels: 0.9952, 0.9982, 1.0000, 1.0032.
Support levels: 0.9918, 0.9892, 0.9863.
Trading tips
To open long positions, one can rely on the breakout of 0.9970-0.9982 when appropriate signals from the technical indicators appear. Take-profit — 1.0020-1.0032. Stop loss – 0.9955. Implementation time: 2-3 days.
The breakdown of 0.9925-0.9918 may serve as a signal to the beginning of sales with the target at 0.9880 or 0.9863. Stop loss – 0.9945. Implementation time: 2-3 days.


No comments:
Write comments