
Visa Inc. (V/NYSE): general analysis
20 August 2018, 11:02
| Scenario | |
|---|---|
| Timeframe | Intraday |
| Recommendation | BUY STOP |
| Entry Point | 143.10 |
| Take Profit | 146.00, 148.00, 150.00 |
| Stop Loss | 140.00 |
| Key Levels | 132.00, 136.00, 139.50, 143.00 |
| Alternative scenario | |
|---|---|
| Recommendation | SELL STOP |
| Entry Point | 139.40 |
| Take Profit | 135.00, 133.00 |
| Stop Loss | 142.00 |
| Key Levels | 132.00, 136.00, 139.50, 143.00 |
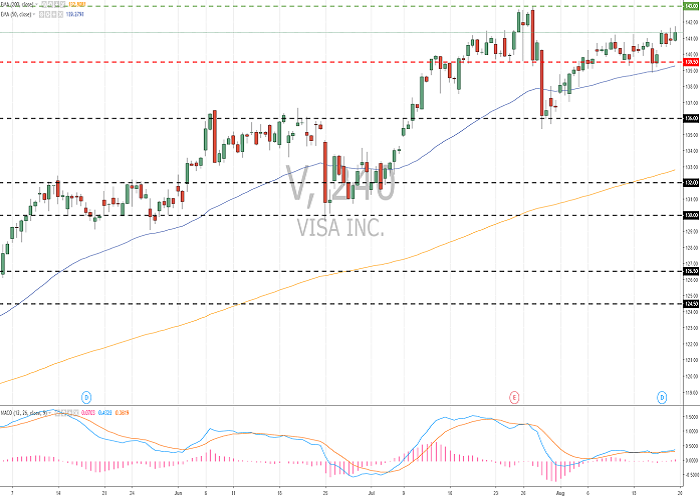
Current trend
Since the beginning of August, Visa shares have strengthened by 3.38% and now are trading near the 52-week high. Since the beginning of the year, the price grew by 23.95%. At the end of July, the company published another strong quarterly report, exceeding market expectations for earnings per share by 10%. In 2018, Visa predicts profit growth of 32%, in the next 2 years – by 16%.
Over the past week, Visa quotes rose 1.15% against the growth of S&P 500 index by 0.64%.
Support and resistance
At the moment, the company's shares are consolidated. The issuer is testing historical highs. The key levels of support and resistance are 139.50 and 143.00. In the near future, a technical correction after a protracted rally is not excluded. Indicators do not give a clear signal: the price was fixed above MA (50) and MA (200); MACD histogram is near the zero line. It is better to open the positions from the key levels.
The comparative analysis of the indicators of the company and its competitors suggests the neutrality of its share prices.
Resistance levels: 143.00.
Support levels: 139.50, 136.00, 132.00.
Trading tips
Long positions can be opened after the price is fixed above the level of 143.00. 146.00, 148.00 and 150.00. The closing of the profitable positions is possible at the levels. Stop loss is 140.00.
Short positions can be opened after the price is set below the level of 139.50 with the targets at 135.00–133.00. Stop loss is 142.00.
Implementation period: 3 days.


No comments:
Write comments