
USD/CHF: general review
15 August 2018, 12:29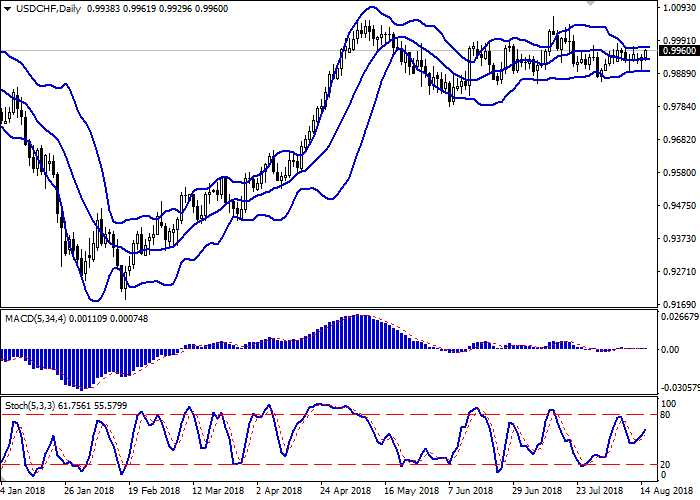
| Scenario | |
|---|---|
| Timeframe | Intraday |
| Recommendation | BUY STOP |
| Entry Point | 0.9992, 1.0010 |
| Take Profit | 1.0032, 1.0050 |
| Stop Loss | 0.9970 |
| Key Levels | 0.9863, 0.9892, 0.9918, 0.9952, 0.9982, 1.0000, 1.0032, 1.0065 |
| Alternative scenario | |
|---|---|
| Recommendation | SELL STOP |
| Entry Point | 0.9960 |
| Take Profit | 0.9918 |
| Stop Loss | 0.9980 |
| Key Levels | 0.9863, 0.9892, 0.9918, 0.9952, 0.9982, 1.0000, 1.0032, 1.0065 |
Current trend
Despite the decline on Tuesday, the pair USD/CHF was able to recover by the end of the afternoon session due to the macroeconomic statistics from Europe. Thus, investors reacted negatively to the slowing of the Swiss producer and import price index in July from +0.2% to +0.1% MoM with the forecast +0.3% MoM. In annual terms, however, the indicator accelerated from +3.5% to +3.6% YoY, which was better than expectations +3.4% YoY.
In general, investors are waiting for the July data on retail sales and industrial production in the US on Wednesday. It is predicted that the statistics may be poor and will affect the American currency negatively. Retail Sales may fall from 0.5% to 0.1% and Industrial Production may fall from 0.6% to 0.3%. The traders are also focused on the possible reaction of the US administration to the threats of Turkish President Recep Tayyip Erdogan to boycott the American electronics industry.
Support and resistance
The Bollinger bands on the daily chart are horizontal. The MACD indicator stretches along the zero line, reflecting the flat trade dynamics. The Stochastic is directed upwards, which is partly due to the moderate growth of the dollar during the Asian session on August 15th.
It is better to wait for the more precise signals from technical indicators.
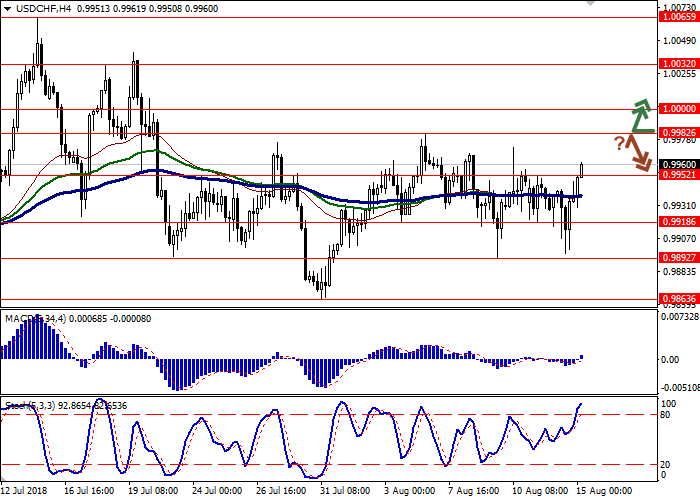
Resistance levels: 0.9982, 1.0000, 1.0032, 1.0065.
Support levels: 0.9952, 0.9918, 0.9892, 0.9863.

Trading tips
To open long positions, you can rely on a breakout of the levels of 0.9982 and 1.0000. Take profit is 1.0032 or 1.0050. Stop loss is 0.9970. Term of realization: 2-3 days.
The breakdown of 0.9970 can be a signal for sales with the target of 0.9918. Stop loss is 0.9980. Term of realization: 2-3 days.
Despite the decline on Tuesday, the pair USD/CHF was able to recover by the end of the afternoon session due to the macroeconomic statistics from Europe. Thus, investors reacted negatively to the slowing of the Swiss producer and import price index in July from +0.2% to +0.1% MoM with the forecast +0.3% MoM. In annual terms, however, the indicator accelerated from +3.5% to +3.6% YoY, which was better than expectations +3.4% YoY.
In general, investors are waiting for the July data on retail sales and industrial production in the US on Wednesday. It is predicted that the statistics may be poor and will affect the American currency negatively. Retail Sales may fall from 0.5% to 0.1% and Industrial Production may fall from 0.6% to 0.3%. The traders are also focused on the possible reaction of the US administration to the threats of Turkish President Recep Tayyip Erdogan to boycott the American electronics industry.
Support and resistance
The Bollinger bands on the daily chart are horizontal. The MACD indicator stretches along the zero line, reflecting the flat trade dynamics. The Stochastic is directed upwards, which is partly due to the moderate growth of the dollar during the Asian session on August 15th.
It is better to wait for the more precise signals from technical indicators.
Resistance levels: 0.9982, 1.0000, 1.0032, 1.0065.
Support levels: 0.9952, 0.9918, 0.9892, 0.9863.
Trading tips
To open long positions, you can rely on a breakout of the levels of 0.9982 and 1.0000. Take profit is 1.0032 or 1.0050. Stop loss is 0.9970. Term of realization: 2-3 days.
The breakdown of 0.9970 can be a signal for sales with the target of 0.9918. Stop loss is 0.9980. Term of realization: 2-3 days.


No comments:
Write comments