
Bitcoin: technical analysis
15 August 2018, 12:36
| Scenario | |
|---|---|
| Timeframe | Intraday |
| Recommendation | BUY STOP |
| Entry Point | 6500.00 |
| Take Profit | 6718.75, 6875.00 |
| Stop Loss | 6400.00 |
| Key Levels | 5937.50, 6093.75, 6250.00, 6471.25, 6718.75, 6875.00 |
| Alternative scenario | |
|---|---|
| Recommendation | SELL STOP |
| Entry Point | 6230.00 |
| Take Profit | 6093.75, 5937.50 |
| Stop Loss | 6300.00 |
| Key Levels | 5937.50, 6093.75, 6250.00, 6471.25, 6718.75, 6875.00 |
Current trend
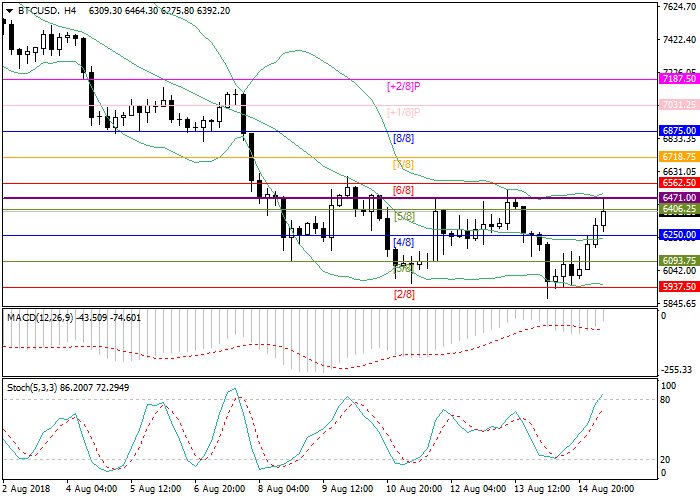
Quotes of Bitcoin are recovering after a decrease to the support level of 5937.50 (Murray [2/8]). The first serious resistance may be at the zone of 6471.00-6562.50, which was impassable for Bitcoin during almost a week.
In case of breakout of the level of 6562.50, the main goal for buyers in the short term will be the level of 6875.00 (Murray [8/8]). On the 4-hour chart, technical indicators show a moderate continuation of the current upward trend. MACD is shrinking in the negative zone and is going to move to the positive zone. The Bollinger bands show a small divergence, confirming the current trend. Stochastics lines are directed upwards.
Support and resistance
Support levels: 6250.00, 6093.75, 5937.50.
Resistance levels: 6471.25, 6718.75, 6875.00.
Trading tips
Long positions will become relevant above the level of 6471.00 with targets in the area of 6718.75 - 6875.00 and stop loss at 6400.00.
Short positions can be set below level 6250.00 with targets in the area of 6093.75 - 5937.50 and stop loss at the level of 6300.00.


No comments:
Write comments