
USD/CAD: the instrument is declining
22 August 2018, 09:53
| Scenario | |
|---|---|
| Timeframe | Intraday |
| Recommendation | BUY STOP |
| Entry Point | 1.3060 |
| Take Profit | 1.3150, 1.3173, 1.3200 |
| Stop Loss | 1.3000 |
| Key Levels | 1.2900, 1.2961, 1.3000, 1.3055, 1.3100, 1.3173, 1.3200 |
| Alternative scenario | |
|---|---|
| Recommendation | SELL STOP |
| Entry Point | 1.3290 |
| Take Profit | 1.2900 |
| Stop Loss | 1.3055 |
| Key Levels | 1.2900, 1.2961, 1.3000, 1.3055, 1.3100, 1.3173, 1.3200 |
Current trend
USD insignificantly decreased against CAD on Tuesday, having updated local lows since August 9.
The pressure was provided by rather harsh statements by US President Donald Trump regarding the policy of import duties, as well as another round of declining yield on government bonds. Trump's speech disappointed investors who expected a positive outcome of the US-China trade negotiations. In addition, Trump again expressed dissatisfaction with the gradual tightening of the monetary policy by the Fed, noting that the regulator should do more to restore and stabilize the national economy.
A more confident growth of the Canadian dollar on Tuesday was hampered by weak statistics. Thus, the wholesale sales index in June fell sharply by 0.8% MoM after an increase of 0.9% MoM last month and a forecast of +0.8% MoM.
Support and resistance
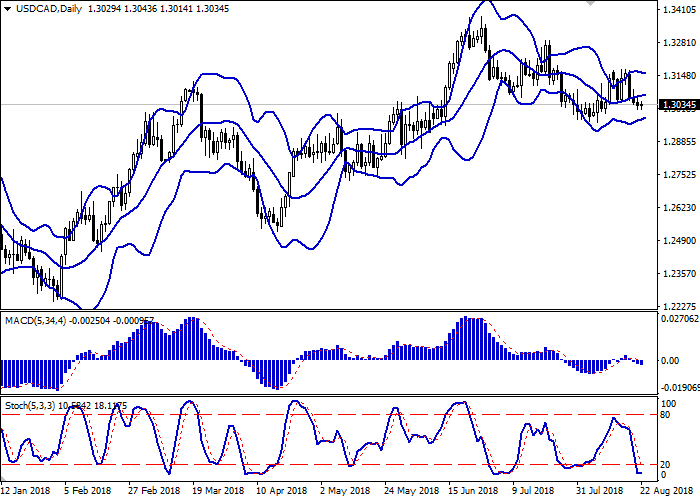
Bollinger Bands in D1 chart demonstrate flat dynamics. The price range is slightly narrowing from below, reflecting the emergence of ambiguous trading dynamics. MACD is going down preserving a moderate sell signal (being located under the signal line). Stochastic, having reached its minimum levels, reversed horizontally, reflecting the risks of the oversold USD in the short term.
There's a possibility of a correction in the short and/or ultra-short term.
Resistance levels: 1.3055, 1.3100, 1.3173, 1.3200.
Support levels: 1.3000, 1.2961, 1.2900.
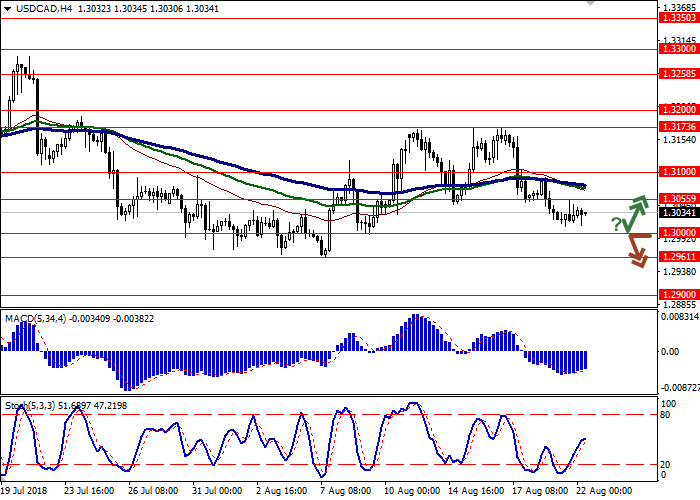
Trading tips
Long positions may be opened if the price moves away from the level of 1.3000, as from support, followed by the breakout of 1.3055. Take profit — 1.3150-1.3173 or 1.3200. Stop loss – 1.3000. Implementation time: 2-3 days.
A confident breakdown of the level of 1.3000 may serve as a signal to the beginning of sales with the target at 1.2900. Stop loss – 1.3055. Implementation time: 2-3 days.
USD insignificantly decreased against CAD on Tuesday, having updated local lows since August 9.
The pressure was provided by rather harsh statements by US President Donald Trump regarding the policy of import duties, as well as another round of declining yield on government bonds. Trump's speech disappointed investors who expected a positive outcome of the US-China trade negotiations. In addition, Trump again expressed dissatisfaction with the gradual tightening of the monetary policy by the Fed, noting that the regulator should do more to restore and stabilize the national economy.
A more confident growth of the Canadian dollar on Tuesday was hampered by weak statistics. Thus, the wholesale sales index in June fell sharply by 0.8% MoM after an increase of 0.9% MoM last month and a forecast of +0.8% MoM.
Support and resistance
Bollinger Bands in D1 chart demonstrate flat dynamics. The price range is slightly narrowing from below, reflecting the emergence of ambiguous trading dynamics. MACD is going down preserving a moderate sell signal (being located under the signal line). Stochastic, having reached its minimum levels, reversed horizontally, reflecting the risks of the oversold USD in the short term.
There's a possibility of a correction in the short and/or ultra-short term.
Resistance levels: 1.3055, 1.3100, 1.3173, 1.3200.
Support levels: 1.3000, 1.2961, 1.2900.
Trading tips
Long positions may be opened if the price moves away from the level of 1.3000, as from support, followed by the breakout of 1.3055. Take profit — 1.3150-1.3173 or 1.3200. Stop loss – 1.3000. Implementation time: 2-3 days.
A confident breakdown of the level of 1.3000 may serve as a signal to the beginning of sales with the target at 1.2900. Stop loss – 1.3055. Implementation time: 2-3 days.


No comments:
Write comments