
USD/CAD: instrument consolidates
14 August 2018, 10:59
| Scenario | |
|---|---|
| Timeframe | Intraday |
| Recommendation | BUY STOP |
| Entry Point | 1.3160 |
| Take Profit | 1.3230, 1.3258 |
| Stop Loss | 1.3100 |
| Key Levels | 1.2900, 1.2961, 1.3000, 1.3061, 1.3100, 1.3156, 1.3200, 1.3258, 1.3300 |
| Alternative scenario | |
|---|---|
| Recommendation | SELL STOP |
| Entry Point | 1.3090 |
| Take Profit | 1.3000 |
| Stop Loss | 1.3150 |
| Key Levels | 1.2900, 1.2961, 1.3000, 1.3061, 1.3100, 1.3156, 1.3200, 1.3258, 1.3300 |
Current trend
The US Dollar fell against the Canadian currency on Monday, 13 August, after renewing local highs since 24 July.
As there is a lack of significant economic releases, USD moves due to technical factors. It is supported by strong July US inflation data. Instead of the expected growth, the consumer price index remained at the same level of 2.9%, but the base consumer price index rose from 2.3% to 2.4%. Investors are confident that the regulator will raise the interest rate twice more. Most likely, this will happen at the September and December Fed’s meetings.
The key US data will be released on Wednesday, when the July data on retail sales and industrial production will be published. It is forecasted that the volume of retail sales may fall from 0.5% to 0.3%, and the index of industrial production can decrease from 0.6% to 0.3%. The implementation of forecasts can affect the USD negatively.
Support and resistance
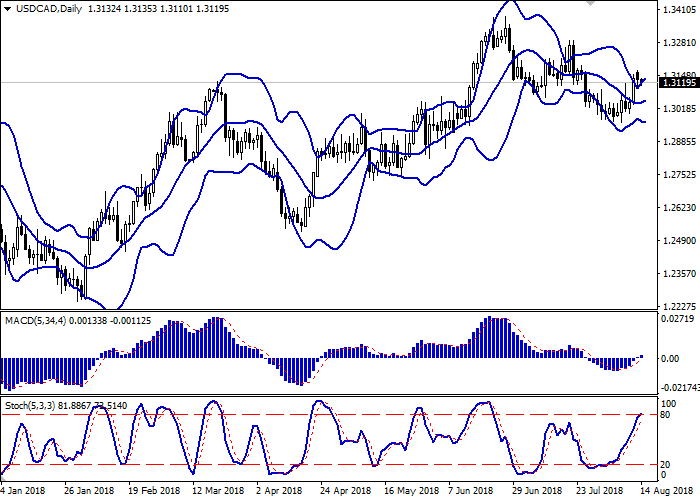
The Bollinger Bands on the daily chart is showing a gradual reverse upwards. The price range is widening but cannot cope with high volatility on the market yet. The MACD is growing and keeping a quite strong buy signal (the histogram remains above the signal line). The Stochastic is growing but is approaching its maximum levels, suggesting the USD is overbought.
Current indicators’ readings do not contradict further Bullish trend development.
Support levels: 1.3100, 1.3061, 1.3000, 1.2961, 1.2900.
Resistance levels: 1.3156, 1.3200, 1.3258, 1.3300.
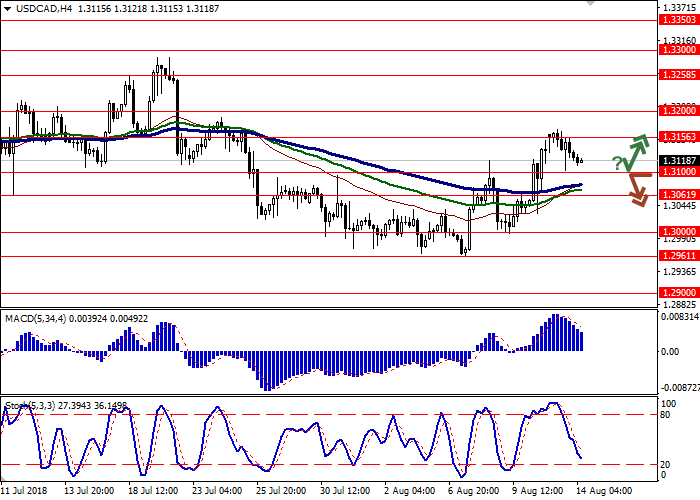
Trading tips
Long positions can be opened after the breakout of the level of 1.3156 with targets at 1.3230, 1.3258 and stop-loss at 1.3100. Validity – 2-3 days.
Short positions can be opened after the breakdown of the level of 1.3100 with the target at 1.3000 and stop-loss at 1.3150. Validity – 2-3 days.
The US Dollar fell against the Canadian currency on Monday, 13 August, after renewing local highs since 24 July.
As there is a lack of significant economic releases, USD moves due to technical factors. It is supported by strong July US inflation data. Instead of the expected growth, the consumer price index remained at the same level of 2.9%, but the base consumer price index rose from 2.3% to 2.4%. Investors are confident that the regulator will raise the interest rate twice more. Most likely, this will happen at the September and December Fed’s meetings.
The key US data will be released on Wednesday, when the July data on retail sales and industrial production will be published. It is forecasted that the volume of retail sales may fall from 0.5% to 0.3%, and the index of industrial production can decrease from 0.6% to 0.3%. The implementation of forecasts can affect the USD negatively.
Support and resistance
The Bollinger Bands on the daily chart is showing a gradual reverse upwards. The price range is widening but cannot cope with high volatility on the market yet. The MACD is growing and keeping a quite strong buy signal (the histogram remains above the signal line). The Stochastic is growing but is approaching its maximum levels, suggesting the USD is overbought.
Current indicators’ readings do not contradict further Bullish trend development.
Support levels: 1.3100, 1.3061, 1.3000, 1.2961, 1.2900.
Resistance levels: 1.3156, 1.3200, 1.3258, 1.3300.
Trading tips
Long positions can be opened after the breakout of the level of 1.3156 with targets at 1.3230, 1.3258 and stop-loss at 1.3100. Validity – 2-3 days.
Short positions can be opened after the breakdown of the level of 1.3100 with the target at 1.3000 and stop-loss at 1.3150. Validity – 2-3 days.


No comments:
Write comments