USD/JPY: the dollar is strengthening
14 August 2018, 11:08
| Scenario | |
|---|---|
| Timeframe | Intraday |
| Recommendation | BUY STOP |
| Entry Point | 111.10, 111.20 |
| Take Profit | 111.85, 112.13 |
| Stop Loss | 110.73 |
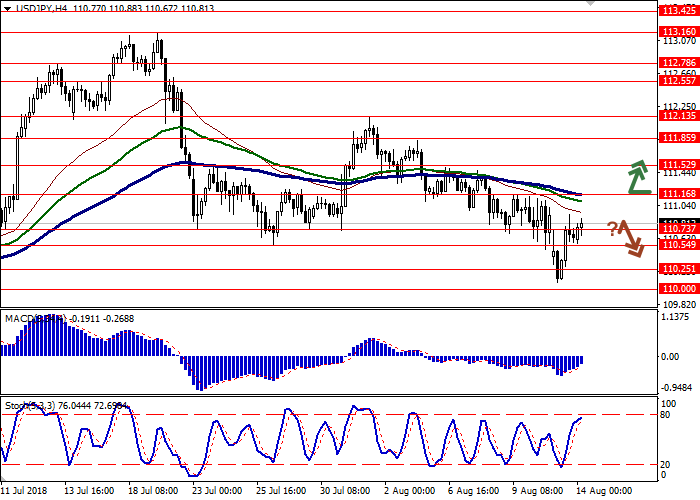
| Key Levels | 110.00, 110.25, 110.54, 110.73, 111.16, 111.52, 111.85, 112.13 |
| Alternative scenario | |
|---|---|
| Recommendation | SELL STOP |
| Entry Point | 110.65, 110.50 |
| Take Profit | 110.25, 110.00 |
| Stop Loss | 110.90, 111.00 |
| Key Levels | 110.00, 110.25, 110.54, 110.73, 111.16, 111.52, 111.85, 112.13 |
Current trend
Yesterday, USD grew steadily against JPY, despite the fact that in the first half of the day "bearish" sentiment prevailed, and the instrument renewed its lows since June 28.
Today, the upward trend continues to develop. Investors are focused on macroeconomic statistics from China and Japan. Thus, July Retail Sales in China fell from 9.0% YoY to 8.8% YoY, which was worse than analysts' expectations. The volume of industrial production in China maintained its previous growth rates of 6.0% YoY, despite forecasts for their acceleration to 6.3% YoY.
Statistics of Japan was slightly better than negative forecasts, but it still did not support JPY significantly. In June, Industrial Production fell by 1.8% MoM and 0.9% YoY, while analysts expected a fall of -2.1% MoM and -5.0% YoY.
Support and resistance
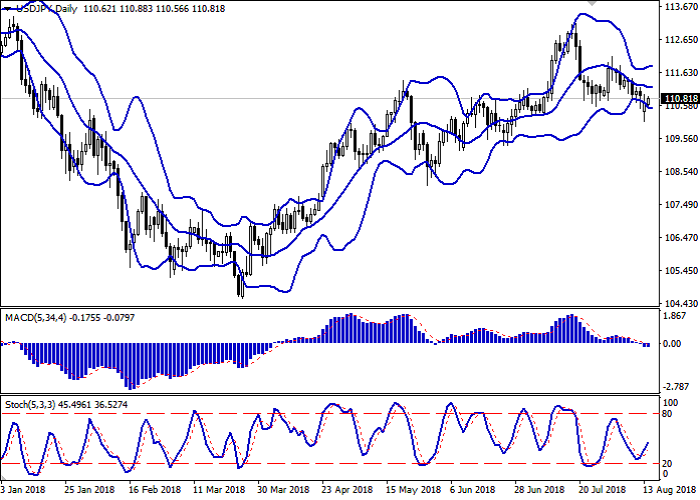
On the daily chart, Bollinger bands are moving flat. The price range tries to consolidate within a wide range. MACD indicator decreases, keeping a weak sell signal (the histogram is below the signal line). Stochastic moves upwards rebounded from level 20.
The development of a corrective upward dynamics is possible in the short term.
Resistance levels: 111.16, 111.52, 111.85, 112.13.
Support levels: 110.73, 110.54, 110.25, 110.00.


Trading tips
Long positions can be opened after the breakout of the levels of 111.00–111.16 with the target at 111.85 or 112.13 and stop loss 110.73. Implementation period: 2–3 days.
Short positions can be opened after a reversal and breakdown of the levels of 110.73–110.54 with the target at 110.25 or 110.00 and stop loss 110.90–111.00. Implementation period: 1–2 days.
Yesterday, USD grew steadily against JPY, despite the fact that in the first half of the day "bearish" sentiment prevailed, and the instrument renewed its lows since June 28.
Today, the upward trend continues to develop. Investors are focused on macroeconomic statistics from China and Japan. Thus, July Retail Sales in China fell from 9.0% YoY to 8.8% YoY, which was worse than analysts' expectations. The volume of industrial production in China maintained its previous growth rates of 6.0% YoY, despite forecasts for their acceleration to 6.3% YoY.
Statistics of Japan was slightly better than negative forecasts, but it still did not support JPY significantly. In June, Industrial Production fell by 1.8% MoM and 0.9% YoY, while analysts expected a fall of -2.1% MoM and -5.0% YoY.
Support and resistance
On the daily chart, Bollinger bands are moving flat. The price range tries to consolidate within a wide range. MACD indicator decreases, keeping a weak sell signal (the histogram is below the signal line). Stochastic moves upwards rebounded from level 20.
The development of a corrective upward dynamics is possible in the short term.
Resistance levels: 111.16, 111.52, 111.85, 112.13.
Support levels: 110.73, 110.54, 110.25, 110.00.


Trading tips
Long positions can be opened after the breakout of the levels of 111.00–111.16 with the target at 111.85 or 112.13 and stop loss 110.73. Implementation period: 2–3 days.
Short positions can be opened after a reversal and breakdown of the levels of 110.73–110.54 with the target at 110.25 or 110.00 and stop loss 110.90–111.00. Implementation period: 1–2 days.


No comments:
Write comments