
NZD/USD: NZD is strengthening
21 August 2018, 10:29
| Scenario | |
|---|---|
| Timeframe | Intraday |
| Recommendation | BUY STOP |
| Entry Point | 0.6690 |
| Take Profit | 0.6740, 0.6760 |
| Stop Loss | 0.6650 |
| Key Levels | 0.6560, 0.6600, 0.6622, 0.6650, 0.6686, 0.6712, 0.6746, 0.6760 |
| Alternative scenario | |
|---|---|
| Recommendation | SELL STOP |
| Entry Point | 0.6640 |
| Take Profit | 0.6600, 0.6560, 0.6543 |
| Stop Loss | 0.6700 |
| Key Levels | 0.6560, 0.6600, 0.6622, 0.6650, 0.6686, 0.6712, 0.6746, 0.6760 |
Current trend
NZD slightly changed against USD on August 20 but managed to keep the "bullish" sentiment formed at the end of last week.
The traders are focused on US-China trade negotiations and the annual meeting of the heads of world regulators in Jackson Hole. Negotiations between China's Deputy Minister of Trade Wang Shouwen and US Deputy Secretary of Treasury David Malpass may be held in the nearest future, but their result is unlikely to be significant, as the US administration, represented by President Trump, has already stated that the PRC government could not have offered the US an acceptable agreement. However, the traders are optimistic. During the three-day economic symposium in Jackson Hole, the Fed head Jerome Powell will make a speech about monetary policy. Investors wait for hints on the further actions of the American regulator.
Support and resistance
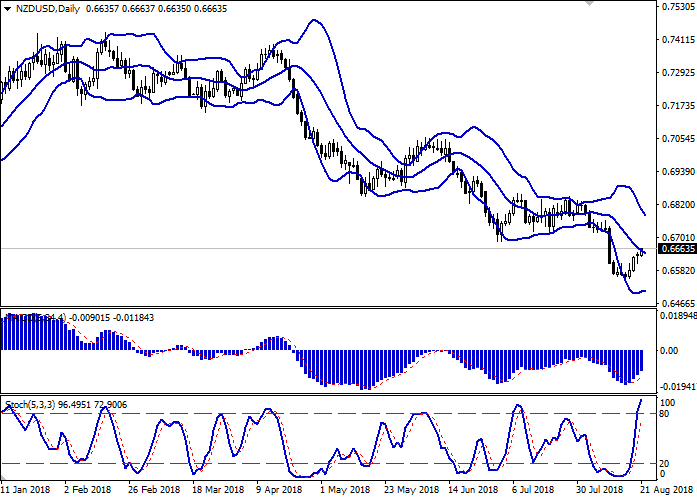
Bollinger Bands in D1 chart demonstrate a gradual decrease. The price range narrows, reacting to a sharp change in the direction of short-term trading. MACD indicator is growing preserving a stable buy signal (the histogram is above the signal line). Stochastic keeps its upward direction but has already reached its maximum levels, which signals an overbought NZD in the nearest time.
Indicators confirm the possibility of further development of the "bullish" trend in the short and/or ultra-short term.
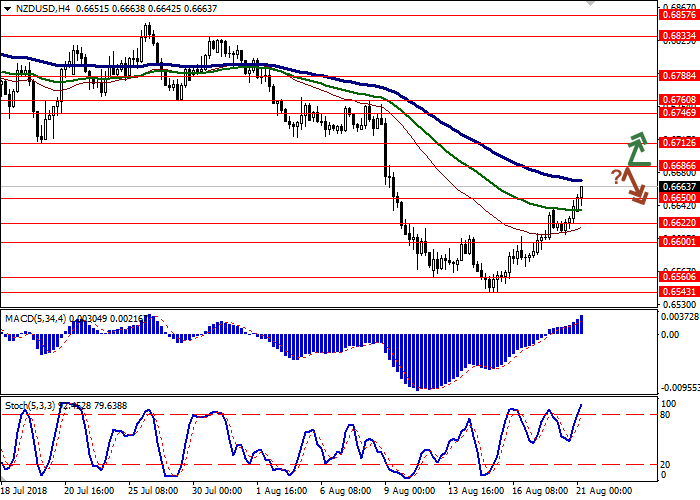
Resistance levels: 0.6686, 0.6712, 0.6746, 0.6760.
Support levels: 0.6650, 0.6622, 0.6600, 0.6560.
Trading tips
To open long positions, one can rely on the breakout of 0.6686. Take-profit — 0.6740-0.6760. Stop loss – 0.6650. Implementation time: 1-2 days.
A rebound from the level of 0.6686, as from resistance, followed by a breakdown of 0.6650, may become a signal for sales with the target at 0.6600. More long-term sales can be targeted at 0.6560-0.6543. Stop loss – 0.6700. Implementation time: 2-3 days.
NZD slightly changed against USD on August 20 but managed to keep the "bullish" sentiment formed at the end of last week.
The traders are focused on US-China trade negotiations and the annual meeting of the heads of world regulators in Jackson Hole. Negotiations between China's Deputy Minister of Trade Wang Shouwen and US Deputy Secretary of Treasury David Malpass may be held in the nearest future, but their result is unlikely to be significant, as the US administration, represented by President Trump, has already stated that the PRC government could not have offered the US an acceptable agreement. However, the traders are optimistic. During the three-day economic symposium in Jackson Hole, the Fed head Jerome Powell will make a speech about monetary policy. Investors wait for hints on the further actions of the American regulator.
Support and resistance
Bollinger Bands in D1 chart demonstrate a gradual decrease. The price range narrows, reacting to a sharp change in the direction of short-term trading. MACD indicator is growing preserving a stable buy signal (the histogram is above the signal line). Stochastic keeps its upward direction but has already reached its maximum levels, which signals an overbought NZD in the nearest time.
Indicators confirm the possibility of further development of the "bullish" trend in the short and/or ultra-short term.
Resistance levels: 0.6686, 0.6712, 0.6746, 0.6760.
Support levels: 0.6650, 0.6622, 0.6600, 0.6560.
Trading tips
To open long positions, one can rely on the breakout of 0.6686. Take-profit — 0.6740-0.6760. Stop loss – 0.6650. Implementation time: 1-2 days.
A rebound from the level of 0.6686, as from resistance, followed by a breakdown of 0.6650, may become a signal for sales with the target at 0.6600. More long-term sales can be targeted at 0.6560-0.6543. Stop loss – 0.6700. Implementation time: 2-3 days.


No comments:
Write comments