
USD/CHF: technical analysis
21 August 2018, 10:55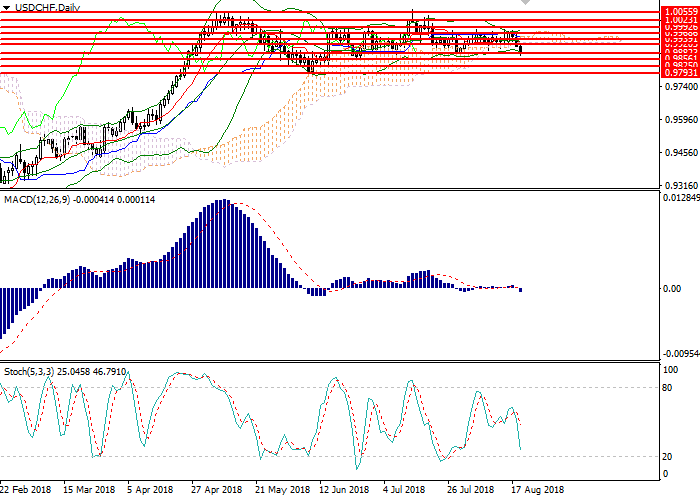
| Scenario | |
|---|---|
| Timeframe | Intraday |
| Recommendation | SELL STOP |
| Entry Point | 0.9865 |
| Take Profit | 0.9825 |
| Stop Loss | 0.9885 |
| Key Levels | 0.9793, 0.9825, 0.9856, 0.9880, 0.9920, 0.9940, 0.9968, 0.9992, 1.0023, 1.0055 |
| Alternative scenario | |
|---|---|
| Recommendation | BUY STOP |
| Entry Point | 0.9895 |
| Take Profit | 0.9940 |
| Stop Loss | 0.9870 |
| Key Levels | 0.9793, 0.9825, 0.9856, 0.9880, 0.9920, 0.9940, 0.9968, 0.9992, 1.0023, 1.0055 |
USD/CHF, D1
On the daily chart, the instrument tests the lower border of Bollinger bands. The indicator is directed horizontally, and the price range has insignificantly expanded, which indicates the continuation of the downward trend. MACD histogram does not give a clear signal for entering the market. Stochastic is preparing to enter the oversold area.

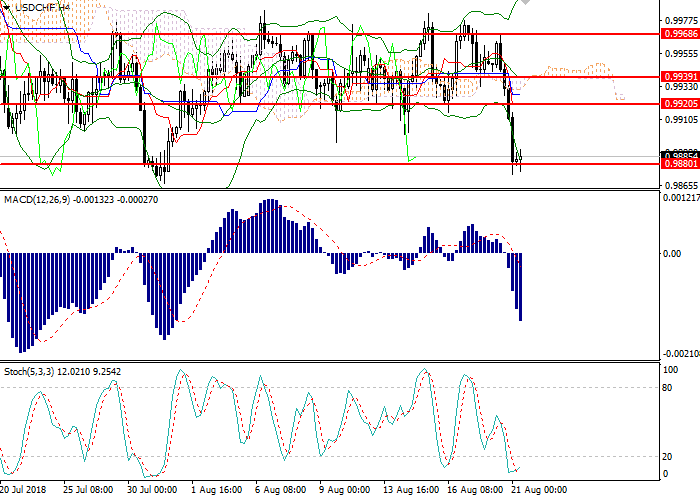
USD/CHF, H4
On the 4-hour chart, the instrument tries to consolidate below the strong support level of 0.9880. Bollinger bands are reversing downwards, and the price range has expanded significantly, which indicates a further decline in the pair. MACD histogram is in the negative zone, holding a strong buy signal. Stochastic entered the oversold zone, a strong signal for purchase can be formed in the next few hours.
Key Levels
Resistance levels: 0.9920, 0.9940, 0.9968, 0.9992, 1.0023, 1.0055.
Support levels: 0.9793, 0.9825, 0.9856, 0.9880.
Trading tips
Short positions can be opened below 0.9870 with the target at 0.9825 and stop loss 0.9885.
Long positions can be opened above the level of 0.9892 with the target at 0.9940 and stop loss 0.9870.
Implementation period: 1–2 days.
On the daily chart, the instrument tests the lower border of Bollinger bands. The indicator is directed horizontally, and the price range has insignificantly expanded, which indicates the continuation of the downward trend. MACD histogram does not give a clear signal for entering the market. Stochastic is preparing to enter the oversold area.
USD/CHF, H4
On the 4-hour chart, the instrument tries to consolidate below the strong support level of 0.9880. Bollinger bands are reversing downwards, and the price range has expanded significantly, which indicates a further decline in the pair. MACD histogram is in the negative zone, holding a strong buy signal. Stochastic entered the oversold zone, a strong signal for purchase can be formed in the next few hours.
Key Levels
Resistance levels: 0.9920, 0.9940, 0.9968, 0.9992, 1.0023, 1.0055.
Support levels: 0.9793, 0.9825, 0.9856, 0.9880.
Trading tips
Short positions can be opened below 0.9870 with the target at 0.9825 and stop loss 0.9885.
Long positions can be opened above the level of 0.9892 with the target at 0.9940 and stop loss 0.9870.
Implementation period: 1–2 days.


No comments:
Write comments