
EUR/USD: euro is correcting
24 August 2018, 10:07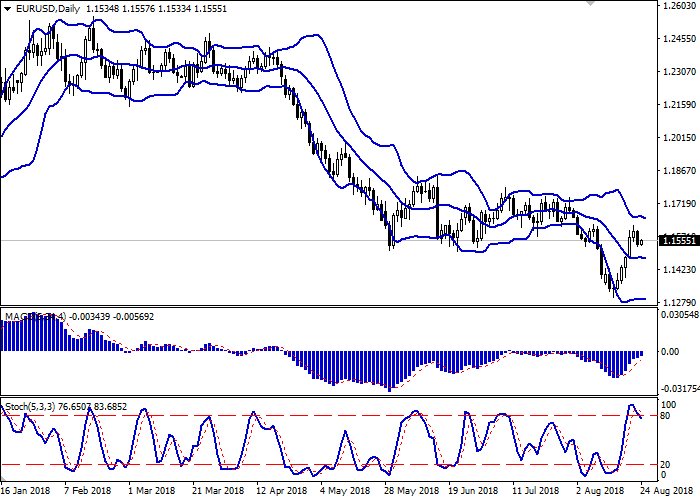
| Scenario | |
|---|---|
| Timeframe | Intraday |
| Recommendation | BUY STOP |
| Entry Point | 1.1580 |
| Take Profit | 1.1653, 1.1689, 1.1700 |
| Stop Loss | 1.1520 |
| Key Levels | 1.1446, 1.1473, 1.1500, 1.1526, 1.1573, 1.1621, 1.1653, 1.1689 |
| Alternative scenario | |
|---|---|
| Recommendation | SELL STOP |
| Entry Point | 1.1520 |
| Take Profit | 1.1446, 1.1400 |
| Stop Loss | 1.1573 |
| Key Levels | 1.1446, 1.1473, 1.1500, 1.1526, 1.1573, 1.1621, 1.1653, 1.1689 |
Current trend
EUR showed a decline against the US dollar on August 23, having receded from the two-week highs, updated the day before.
Published on Thursday, August data on Markit Services and Manufacturing PMI's for Germany and the Eurozone were mixed. Optimism in the services sphere has increased, and in the manufacturing, on the contrary, it decreased due to the uncertainty caused by the world trade conflicts. Markit Services PMI of Germany in August grew from 54.1 to 55.2 points and the same index for the Eurozone - from 54.2 to 54.4 points. Markit Manufacturing PMI for Germany decreased from 56.9 to 56.1 points and for the Eurozone - from 55.1 to 54.6 points.
On Friday, data on Germany's GDP in Q2 2018 was published. The indicator remained at the level of 2.0%, as was expected.
Support and resistance
Bollinger Bands in D1 chart demonstrate flat dynamics. The price range is slightly narrowed from below, remaining rather spacious, given the current level of activity in the market. MACD indicator is growing preserving a stable buy signal (the histogram is above the signal line). Stochastics, moving away from their maximum levels, is declining with a signal for a corrective decline in the overbought euro.
It would be reasonable to wait for clearer trading signals for sales in the short and/or ultra-short term.
Resistance levels: 1.1573, 1.1621, 1.1653, 1.1689.
Support levels: 1.1526, 1.1500, 1.1473, 1.1446.
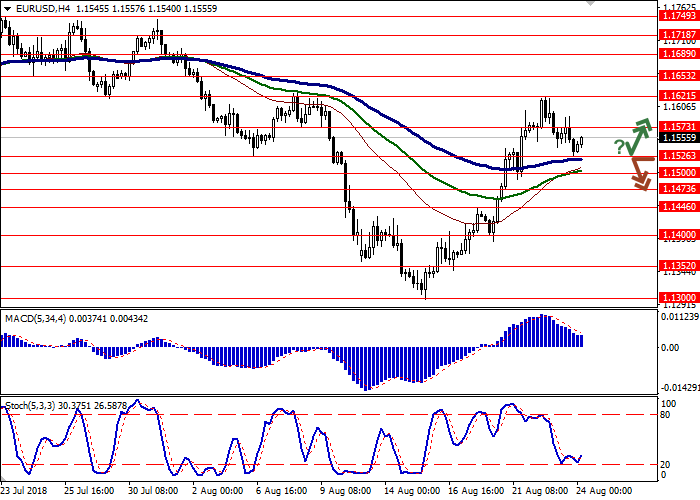

Trading tips
Long positions may be opened if the price moves away from 1.1526, as from support, followed by the breakout of 1.1573. Take profit — 1.1653 or 1.1689-1.1700. Stop loss – 1.1520. Implementation time: 2-3 days.
A confident breakdown of 1.1526 may serve as a signal to further sales with the target at 1.1446 or 1.1400. Stop loss – 1.1573. Implementation time: 2-3 days.
EUR showed a decline against the US dollar on August 23, having receded from the two-week highs, updated the day before.
Published on Thursday, August data on Markit Services and Manufacturing PMI's for Germany and the Eurozone were mixed. Optimism in the services sphere has increased, and in the manufacturing, on the contrary, it decreased due to the uncertainty caused by the world trade conflicts. Markit Services PMI of Germany in August grew from 54.1 to 55.2 points and the same index for the Eurozone - from 54.2 to 54.4 points. Markit Manufacturing PMI for Germany decreased from 56.9 to 56.1 points and for the Eurozone - from 55.1 to 54.6 points.
On Friday, data on Germany's GDP in Q2 2018 was published. The indicator remained at the level of 2.0%, as was expected.
Support and resistance
Bollinger Bands in D1 chart demonstrate flat dynamics. The price range is slightly narrowed from below, remaining rather spacious, given the current level of activity in the market. MACD indicator is growing preserving a stable buy signal (the histogram is above the signal line). Stochastics, moving away from their maximum levels, is declining with a signal for a corrective decline in the overbought euro.
It would be reasonable to wait for clearer trading signals for sales in the short and/or ultra-short term.
Resistance levels: 1.1573, 1.1621, 1.1653, 1.1689.
Support levels: 1.1526, 1.1500, 1.1473, 1.1446.
Trading tips
Long positions may be opened if the price moves away from 1.1526, as from support, followed by the breakout of 1.1573. Take profit — 1.1653 or 1.1689-1.1700. Stop loss – 1.1520. Implementation time: 2-3 days.
A confident breakdown of 1.1526 may serve as a signal to further sales with the target at 1.1446 or 1.1400. Stop loss – 1.1573. Implementation time: 2-3 days.


No comments:
Write comments