
Brent Crude Oil: oil prices are going down
10 August 2018, 10:57
| Scenario | |
|---|---|
| Timeframe | Intraday |
| Recommendation | BUY STOP |
| Entry Point | 72.60 |
| Take Profit | 74.45, 75.50, 75.73 |
| Stop Loss | 71.50 |
| Key Levels | 70.00, 71.12, 71.69, 72.55, 73.62, 74.45, 75.73 |
| Alternative scenario | |
|---|---|
| Recommendation | SELL STOP |
| Entry Point | 71.60 |
| Take Profit | 70.00 |
| Stop Loss | 72.55 |
| Key Levels | 70.00, 71.12, 71.69, 72.55, 73.62, 74.45, 75.73 |
Current trend
Prices for Brent crude oil showed a decline on Thursday, continuing the development of a confident "bearish" momentum, formed the day before. Nevertheless, the "bears" failed to update the local lows of Wednesday, as the trading activity remained rather low.
Yesterday, prices were under pressure due to the latest EIA data on oil stocks, which fell less than the market expected (by 1.351M barrels), while gasoline and diesel stocks rose. In addition, investors are concerned about a new round of the US-China trade war, during which both sides can introduce duties on goods worth USD 16B, and the conflict between Canada and Saudi Arabia, which has already led to the suspension of part of trade relations and social programs between the two countries.
Support and resistance
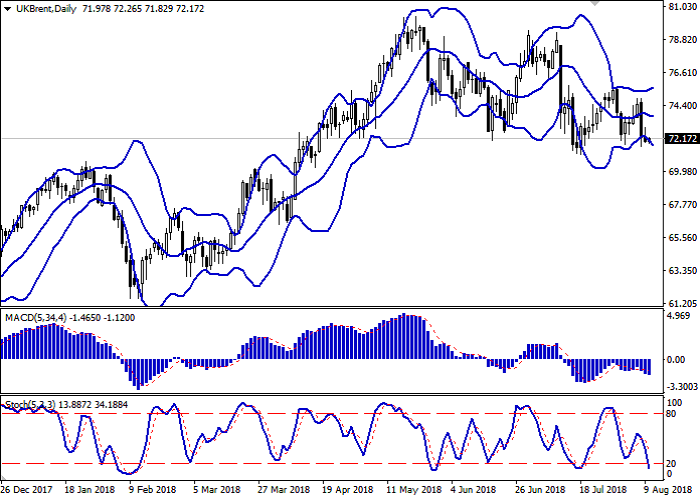
Bollinger Bands in D1 chart demonstrate flat dynamics. The price range expands from below, making way for new local lows for the "bears". MACD is going down preserving a moderate sell signal (located below the signal line). Stochastic keeps the downtrend, but approaches its minimum levels, which indicates the risks of oversold instrument in the short term.
Some of existing short positions in the short and ultra-short term should be left open for some time. To open new transactions, one should wait for additional signals to appear.
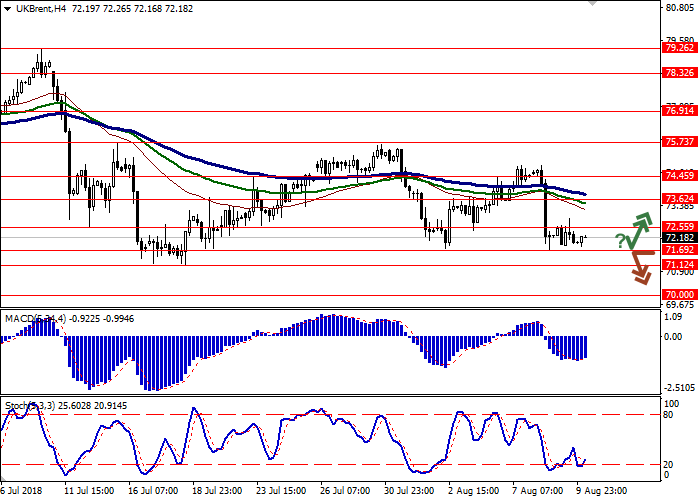
Resistance levels: 72.55, 73.62, 74.45, 75.73.
Support levels: 71.69, 71.12, 70.00.
Trading tips
To open long positions, one can rely on the rebound from the support level of 71.69, with the subsequent breakout of 72.55. Take profit — 74.45 or 75.50, 75.73. Stop loss — 71.50. Implementation period: 2-3 days.
The breakdown of 71.69 may serve as a signal to further sales with the target at 70.00. Stop loss — 72.55. Implementation period: 1-2 days.
Prices for Brent crude oil showed a decline on Thursday, continuing the development of a confident "bearish" momentum, formed the day before. Nevertheless, the "bears" failed to update the local lows of Wednesday, as the trading activity remained rather low.
Yesterday, prices were under pressure due to the latest EIA data on oil stocks, which fell less than the market expected (by 1.351M barrels), while gasoline and diesel stocks rose. In addition, investors are concerned about a new round of the US-China trade war, during which both sides can introduce duties on goods worth USD 16B, and the conflict between Canada and Saudi Arabia, which has already led to the suspension of part of trade relations and social programs between the two countries.
Support and resistance
Bollinger Bands in D1 chart demonstrate flat dynamics. The price range expands from below, making way for new local lows for the "bears". MACD is going down preserving a moderate sell signal (located below the signal line). Stochastic keeps the downtrend, but approaches its minimum levels, which indicates the risks of oversold instrument in the short term.
Some of existing short positions in the short and ultra-short term should be left open for some time. To open new transactions, one should wait for additional signals to appear.
Resistance levels: 72.55, 73.62, 74.45, 75.73.
Support levels: 71.69, 71.12, 70.00.
Trading tips
To open long positions, one can rely on the rebound from the support level of 71.69, with the subsequent breakout of 72.55. Take profit — 74.45 or 75.50, 75.73. Stop loss — 71.50. Implementation period: 2-3 days.
The breakdown of 71.69 may serve as a signal to further sales with the target at 70.00. Stop loss — 72.55. Implementation period: 1-2 days.


No comments:
Write comments