
USD/CHF: the instrument moves sideways
10 August 2018, 11:03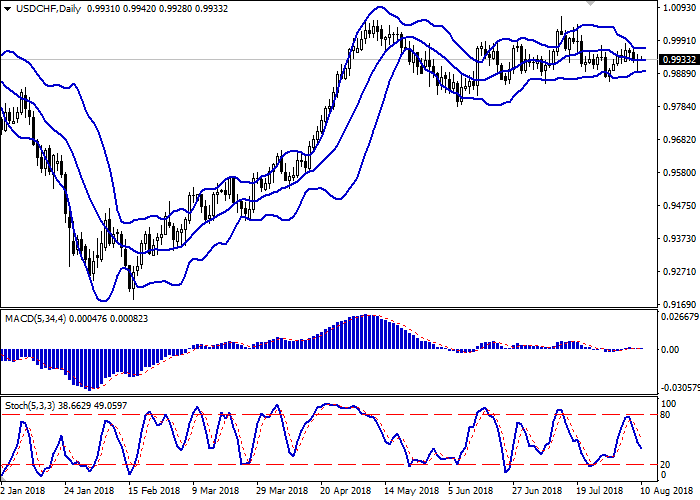
| Scenario | |
|---|---|
| Timeframe | Intraday |
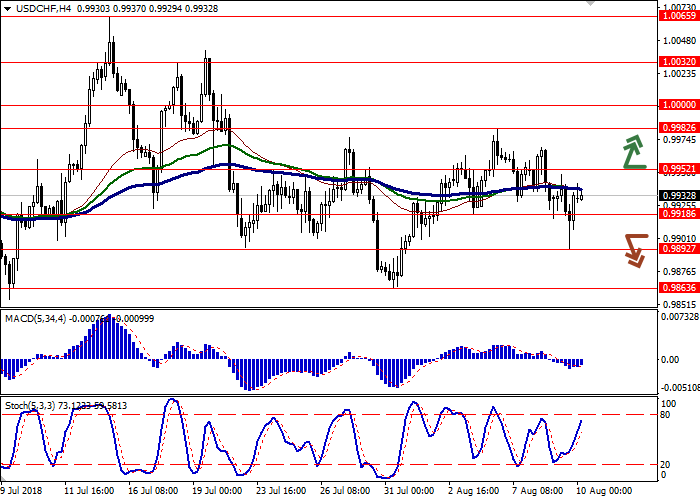
| Recommendation | BUY STOP |
| Entry Point | 0.9960 |
| Take Profit | 1.0000 |
| Stop Loss | 0.9930, 0.9920 |
| Key Levels | 0.9863, 0.9892, 0.9918, 0.9952, 0.9982, 1.0000, 1.0032 |
| Alternative scenario | |
|---|---|
| Recommendation | SELL STOP |
| Entry Point | 0.9900, 0.9890 |
| Take Profit | 0.9863, 0.9850 |
| Stop Loss | 0.9920, 0.9930 |
| Key Levels | 0.9863, 0.9892, 0.9918, 0.9952, 0.9982, 1.0000, 1.0032 |
Current trend
Yesterday, USD fell against CHF, renewing a local minimum since July 31. However, by the end of the session, the dollar restored all the loss.
Worth noting, that USD was corrected against the publication of poor production inflation data. The dynamics of July PPI was zero after growth by 0.3% MoM last month. Analysts expected an increase by 0.2% MoM. The growth of the index slowed from 3.4% YoY to 3.3% YoY, which was also worse than the traders’ expectations.
USD was supported by Initial Jobless Claims release, which decreased from 219K to 213K. In addition, the market reacted positively to the statements of Chicago Fed’s President, Charles Evans, who noted that he admits two more rate increases this year.
Support and resistance
On the daily chart, Bollinger bands are moving flat. The price range stayed the same, reflecting the sideways dynamics of the last days. MACD moves along the zero line, reflecting a flat dynamic in the short and ultra-short term. Stochastic is steadily declining, reacting to the "bearish" surge of Thursday, which does not reflect the real situation on the market.
It is better to wait until the situation is clear and new trade signals appear.
Resistance levels: 0.9952, 0.9982, 1.0000, 1.0032.
Support levels: 0.9918, 0.9892, 0.9863.

Trading tips
Long positions can be opened after the breakout of the level of 0.9952 with the target at 1.0000 and stop loss 0.9930–0.9920.
Short positions can be opened after the breakdown of 0.9910–0.9900 with the targets at 0.9863–0.9850 and stop loss 0.9920–0.9930.
Implementation period: 2–3 days.
Yesterday, USD fell against CHF, renewing a local minimum since July 31. However, by the end of the session, the dollar restored all the loss.
Worth noting, that USD was corrected against the publication of poor production inflation data. The dynamics of July PPI was zero after growth by 0.3% MoM last month. Analysts expected an increase by 0.2% MoM. The growth of the index slowed from 3.4% YoY to 3.3% YoY, which was also worse than the traders’ expectations.
USD was supported by Initial Jobless Claims release, which decreased from 219K to 213K. In addition, the market reacted positively to the statements of Chicago Fed’s President, Charles Evans, who noted that he admits two more rate increases this year.
Support and resistance
On the daily chart, Bollinger bands are moving flat. The price range stayed the same, reflecting the sideways dynamics of the last days. MACD moves along the zero line, reflecting a flat dynamic in the short and ultra-short term. Stochastic is steadily declining, reacting to the "bearish" surge of Thursday, which does not reflect the real situation on the market.
It is better to wait until the situation is clear and new trade signals appear.
Resistance levels: 0.9952, 0.9982, 1.0000, 1.0032.
Support levels: 0.9918, 0.9892, 0.9863.
Trading tips
Long positions can be opened after the breakout of the level of 0.9952 with the target at 1.0000 and stop loss 0.9930–0.9920.
Short positions can be opened after the breakdown of 0.9910–0.9900 with the targets at 0.9863–0.9850 and stop loss 0.9920–0.9930.
Implementation period: 2–3 days.


No comments:
Write comments