
Brent Crude Oil: lateral consolidation or downward movement
22 August 2018, 14:21
| Scenario | |
|---|---|
| Timeframe | Weekly |
| Recommendation | SELL |
| Entry Point | 74.08 |
| Take Profit | 70.70, 68.00 |
| Stop Loss | 77.10 |
| Key Levels | 68.00, 68.75, 70.10, 70.70, 71.50, 72.65, 74.00, 75.00, 76.00, 76.35, 77.70, 78.30, 79.50, 80.50 |
| Alternative scenario | |
|---|---|
| Recommendation | SELL LIMIT |
| Entry Point | 76.35, 77.00 |
| Take Profit | 70.70, 68.00 |
| Stop Loss | 78.60 |
| Key Levels | 68.00, 68.75, 70.10, 70.70, 71.50, 72.65, 74.00, 75.00, 76.00, 76.35, 77.70, 78.30, 79.50, 80.50 |
Current trend
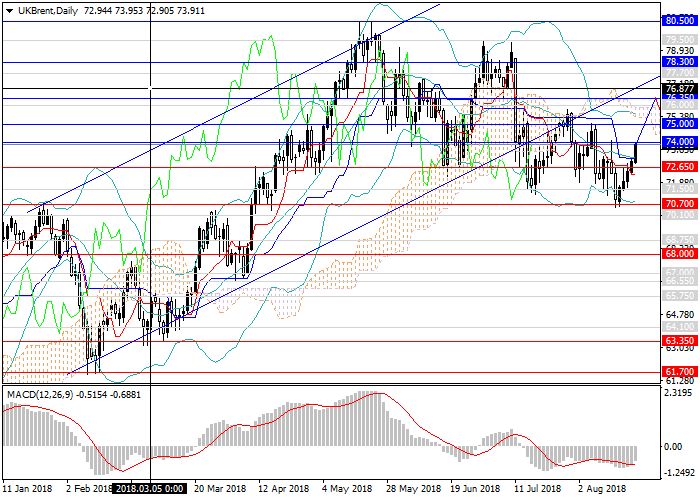
Brent Crude oil continue to decline within the medium-term trend, losing more than USD 6 since the end of May.
This decline does not seem significant after a sharp increase in the price in 2017-2018. The instrument is within a sloping channel with long upward corrections. Since August 15, having tested the local minimum and a strong support level of 70.70, it reversed and went up, gaining USD 3.5. Now the price stopped and is traded below the first serious resistance level of 74.00. Also, the quotes are affected by USD rate: since last week, it declined against all majors, and oil grew in price.
Attention should be paid to the Ministry of Energy's data on the change in oil reserves, the labor market, orders for durable goods, and the FOMC minutes.
Support and resistance
In the medium term, the transition to a broad lateral consolidation is expected after the rapid growth of the last two years. The price is unlikely to update the local highs before the end of this year. An alternative may be deeper corrective downward movement due to a decrease in demand and a serious volume of long positions at a high price. The price has come out of the long-term upward range, and therefore technically does not tend to go up.
Technical indicators on D1 chart and above confirm the forecast: MACD indicates the growth of the volume of short positions, and Bollinger Bands are pointing downwards.
Support levels: 72.65, 71.50, 70.70, 70.10, 68.75, 68.00.
Resistance levels: 74.00, 75.00, 76.00, 76.35, 77.70, 78.30, 79.50, 80.50.
Trading tips
Short positions may be opened from the current level and from key resistance levels of 76.35, 77.00 with targets at 70.70, 68.00 and the stop loss at 78.60.


No comments:
Write comments