
Brent Crude Oil: general review
20 August 2018, 14:13
| Scenario | |
|---|---|
| Timeframe | Weekly |
| Recommendation | SELL STOP |
| Entry Point | 71.80 |
| Take Profit | 70.31, 68.75 |
| Stop Loss | 72.20 |
| Key Levels | 68.75, 70.31, 71.87, 73.43, 75.00, 76.56 |
| Alternative scenario | |
|---|---|
| Recommendation | BUY STOP |
| Entry Point | 73.50 |
| Take Profit | 75.00, 76.56 |
| Stop Loss | 72.10 |
| Key Levels | 68.75, 70.31, 71.87, 73.43, 75.00, 76.56 |
Current trend
Oil quotes have been growing since the middle of last week on reports of upcoming US-China trade talks on August 21-22.
Negotiations can resolve at least some of the contentious issues, although experts warn that there would be no quick results. Quotes are also supported by the probplem of oil transportation from the Perm oil basin. In this regard, the number of active oil rigs in the US for more than two months is within the range of 858-869 units, which is much lower than the peak values of 2014, when it exceeded 1600 units.
The current growth is likely to be limited, as long-term pressures on the market remain. Investors are still concerned about the trade war, which could cause a decrease in oil consumption in the two leading world economies. But the possible shortage after anti-Iran sanctions will be covered by Saudi Arabia, which was confirmed by the country's energy minister Khalid Al-Falih.
Support and resistance
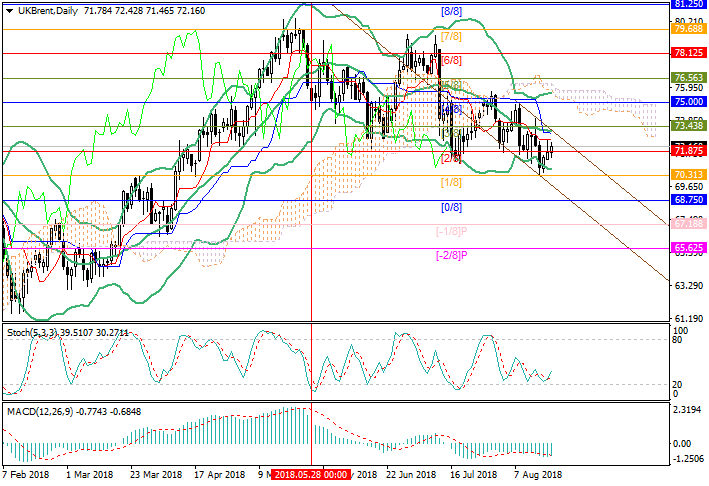
Technically, the price tends to the upper border of the downward channel near the level of 73.43 (Murrey [3/8], the midline of Bollinger Bands). After its breakdown, growth can be continued to 75.00 (Murrey [4/8]) and 76.56 (Murrey [5/8]). The consolidation of the price below 71.87 will lead to the decline to the levels of 70.31 (Murrey [1/8]) and 68.75 (Murrey [0/8]).
Technical indicators show growth: Stochastic reversed up, MACD histogram is reducing in the negative zone. However, the growth potential is seen as limited.
Support levels: 71.87, 70.31, 68.75.
Resistance levels: 73.43, 75.00, 76.56.
Trading tips
Sell positions may be opened below 71.87 with targets at 70.31, 68.75 and stop loss at 72.20.
Buy positions may be opened above 73.43 with targets at 75.00, 76.56 and stop loss at 72.10.
Implementation time: 3-5 days.
Oil quotes have been growing since the middle of last week on reports of upcoming US-China trade talks on August 21-22.
Negotiations can resolve at least some of the contentious issues, although experts warn that there would be no quick results. Quotes are also supported by the probplem of oil transportation from the Perm oil basin. In this regard, the number of active oil rigs in the US for more than two months is within the range of 858-869 units, which is much lower than the peak values of 2014, when it exceeded 1600 units.
The current growth is likely to be limited, as long-term pressures on the market remain. Investors are still concerned about the trade war, which could cause a decrease in oil consumption in the two leading world economies. But the possible shortage after anti-Iran sanctions will be covered by Saudi Arabia, which was confirmed by the country's energy minister Khalid Al-Falih.
Support and resistance
Technically, the price tends to the upper border of the downward channel near the level of 73.43 (Murrey [3/8], the midline of Bollinger Bands). After its breakdown, growth can be continued to 75.00 (Murrey [4/8]) and 76.56 (Murrey [5/8]). The consolidation of the price below 71.87 will lead to the decline to the levels of 70.31 (Murrey [1/8]) and 68.75 (Murrey [0/8]).
Technical indicators show growth: Stochastic reversed up, MACD histogram is reducing in the negative zone. However, the growth potential is seen as limited.
Support levels: 71.87, 70.31, 68.75.
Resistance levels: 73.43, 75.00, 76.56.
Trading tips
Sell positions may be opened below 71.87 with targets at 70.31, 68.75 and stop loss at 72.20.
Buy positions may be opened above 73.43 with targets at 75.00, 76.56 and stop loss at 72.10.
Implementation time: 3-5 days.


No comments:
Write comments