XAU/USD: technical analysis
22 May 2018, 12:46
| Scenario | |
|---|---|
| Timeframe | Intraday |
| Recommendation | SELL STOP |
| Entry Point | 1284.90 |
| Take Profit | 1274.00 |
| Stop Loss | 1295.30 |
| Key Levels | 1261.38, 1270.84, 1281.45, 1285.24, 1289.03, 1294.23, 1298.94, 1304.19, 1314.39, 1324.30, 1332.18 |
| Alternative scenario | |
|---|---|
| Recommendation | BUY STOP |
| Entry Point | 1296.60 |
| Take Profit | 1304.60 |
| Stop Loss | 1284.40 |
| Key Levels | 1261.38, 1270.84, 1281.45, 1285.24, 1289.03, 1294.23, 1298.94, 1304.19, 1314.39, 1324.30, 1332.18 |
XAU/USD, D1
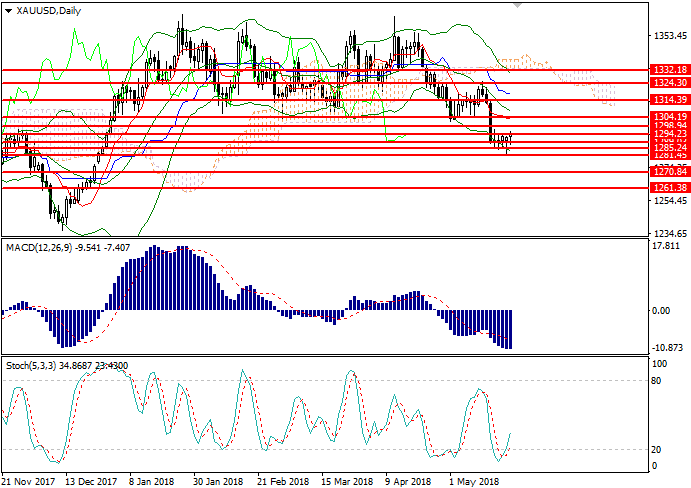
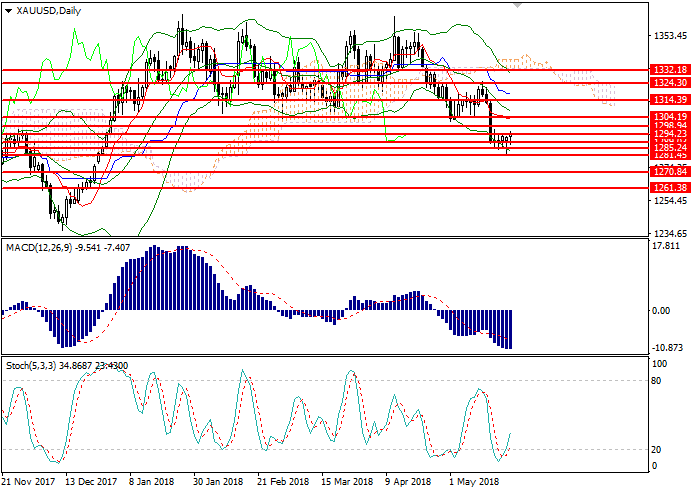
On D1 chart the instrument is trading in the lower part of Bollinger Bands. 1281.45 mark is a significant support. The indicator is directed downwards and the price range has widened which serves as a basis for the further decline of gold quotes. MACD histogram is in the negative zone keeping a strong sell signal. Stochastic has left the oversold zone and formed a strong buy signal.

XAU/USD, H4
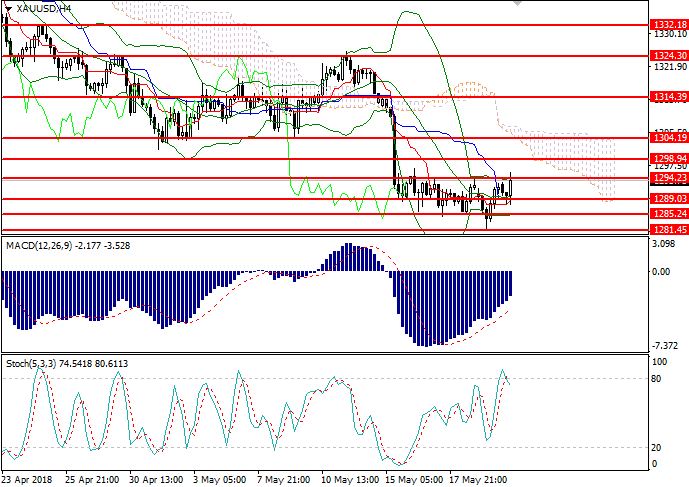
On H4 chart the instrument is testing the resistance level of 1294.23. Bollinger Bands reversed sideways, and the price remains limited by 1294.20-1289.00 range, which indicates the preservation of correction. MACD histogram is in the negative zone keeping the sell signal. Stochastic has reached the overbought area having formed a strong sell signal.

Key levels
Support levels: 1261.38, 1270.84, 1281.45, 1285.24, 1289.03.
Resistance levels: 1294.23, 1298.94, 1304.19, 1314.39, 1324.30, 1332.18.
Trading tips
Short positions could be opened below the level of 1285.00 with the target at 1274.00 and stop-loss at 1295.30. Implementation time: 1-3 days.
Long positions may be opened above the level of 1296.50 with the target at 1304.60 and stop-loss at 1284.40. Implementation time: 1-2 days.
On D1 chart the instrument is trading in the lower part of Bollinger Bands. 1281.45 mark is a significant support. The indicator is directed downwards and the price range has widened which serves as a basis for the further decline of gold quotes. MACD histogram is in the negative zone keeping a strong sell signal. Stochastic has left the oversold zone and formed a strong buy signal.

XAU/USD, H4
On H4 chart the instrument is testing the resistance level of 1294.23. Bollinger Bands reversed sideways, and the price remains limited by 1294.20-1289.00 range, which indicates the preservation of correction. MACD histogram is in the negative zone keeping the sell signal. Stochastic has reached the overbought area having formed a strong sell signal.

Key levels
Support levels: 1261.38, 1270.84, 1281.45, 1285.24, 1289.03.
Resistance levels: 1294.23, 1298.94, 1304.19, 1314.39, 1324.30, 1332.18.
Trading tips
Short positions could be opened below the level of 1285.00 with the target at 1274.00 and stop-loss at 1295.30. Implementation time: 1-3 days.
Long positions may be opened above the level of 1296.50 with the target at 1304.60 and stop-loss at 1284.40. Implementation time: 1-2 days.


No comments:
Write comments