XAU/USD: gold prices are going down
18 May 2018, 10:10
| Scenario | |
|---|---|
| Timeframe | Intraday |
| Recommendation | BUY STOP |
| Entry Point | 1292.10, 1295.10 |
| Take Profit | 1301.40, 1306.70 |
| Stop Loss | 1284.69 |
| Key Levels | 1268.89, 1276.87, 1284.69, 1292.00, 1301.40, 1306.70, 1312.48 |
| Alternative scenario | |
|---|---|
| Recommendation | SELL STOP |
| Entry Point | 1284.60 |
| Take Profit | 1276.87, 1272.00 |
| Stop Loss | 1292.00 |
| Key Levels | 1268.89, 1276.87, 1284.69, 1292.00, 1301.40, 1306.70, 1312.48 |
Current trend
Prices for gold continue to decline and update record lows since late December 2017. The decrease in the instrument is facilitated by the active growth of the US currency, which is supported by an increase in the yield of 10-year treasury bonds to 7-year highs.
At the same time, the uncertainty surrounding trade relations between China and the US hinders a more confident decrease in prices. In addition, analysts reacted negatively to some aggravation of the situation around North Korea after Pyongyang announced the possibility of canceling negotiations between Kim Jong-un and Donald Trump.
Support and resistance
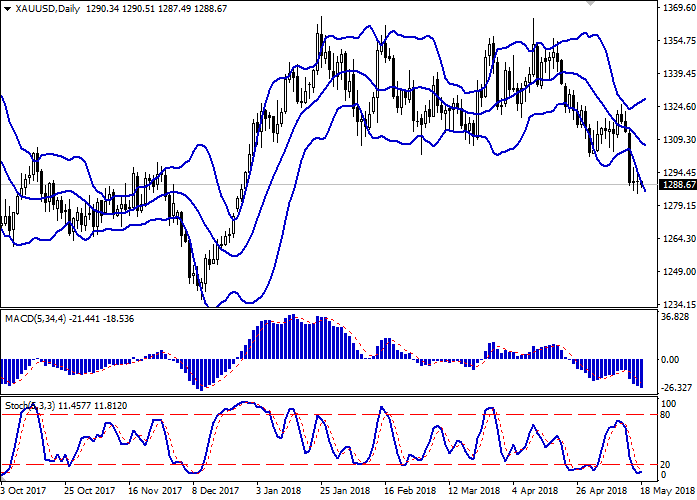
Bollinger Bands in D1 chart demonstrate a stable decrease. The price range is widening but does not conform to the development of the "bearish" trend yet.
MACD is going down preserving a moderate sell signal (histogram is located below the signal line).
Stochastic is about to reverse upwards. At the moment, the indicator is located in close proximity to its minimum levels, which signal the oversold gold in the short term.
One should look at the possibility of corrective growth in the short or ultra-short term due to an intense decline at the beginning of the current trading week. Some of the available short positions can be left open before the signals for a reverse appear.
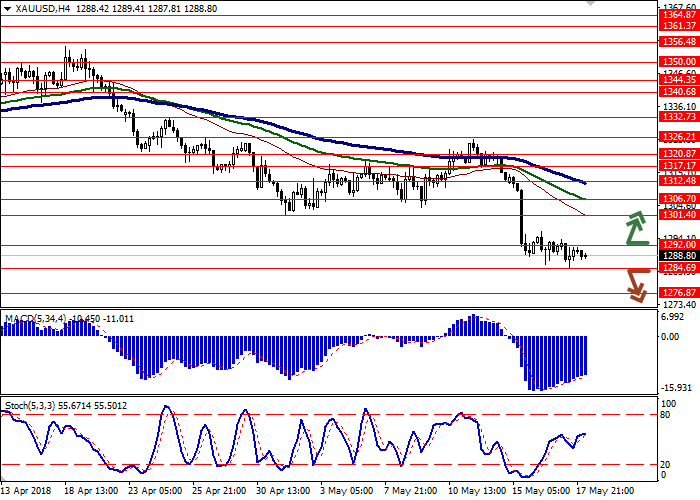
Resistance levels: 1292.00, 1301.40, 1306.70, 1312.48.
Support levels: 1284.69, 1276.87, 1268.89.


Trading tips
To open long positions one can rely on the breakout of the level of 1292.00 or 1295.00 if clear signals for upward reverse appear. Take-profit — 1301.40 or 1306.70. Stop-loss — 1284.69. Implementation period: 2-3 days.
A breakdown of the level of 1284.69 may be a signal to further sales with targets at 1276.87 or 1272.00 marks. Stop-loss — 1292.00. Implementation period: 2-3 days.
Prices for gold continue to decline and update record lows since late December 2017. The decrease in the instrument is facilitated by the active growth of the US currency, which is supported by an increase in the yield of 10-year treasury bonds to 7-year highs.
At the same time, the uncertainty surrounding trade relations between China and the US hinders a more confident decrease in prices. In addition, analysts reacted negatively to some aggravation of the situation around North Korea after Pyongyang announced the possibility of canceling negotiations between Kim Jong-un and Donald Trump.
Support and resistance
Bollinger Bands in D1 chart demonstrate a stable decrease. The price range is widening but does not conform to the development of the "bearish" trend yet.
MACD is going down preserving a moderate sell signal (histogram is located below the signal line).
Stochastic is about to reverse upwards. At the moment, the indicator is located in close proximity to its minimum levels, which signal the oversold gold in the short term.
One should look at the possibility of corrective growth in the short or ultra-short term due to an intense decline at the beginning of the current trading week. Some of the available short positions can be left open before the signals for a reverse appear.
Resistance levels: 1292.00, 1301.40, 1306.70, 1312.48.
Support levels: 1284.69, 1276.87, 1268.89.


Trading tips
To open long positions one can rely on the breakout of the level of 1292.00 or 1295.00 if clear signals for upward reverse appear. Take-profit — 1301.40 or 1306.70. Stop-loss — 1284.69. Implementation period: 2-3 days.
A breakdown of the level of 1284.69 may be a signal to further sales with targets at 1276.87 or 1272.00 marks. Stop-loss — 1292.00. Implementation period: 2-3 days.


No comments:
Write comments