USD/CHF: general review
18 May 2018, 10:55
| Scenario | |
|---|---|
| Timeframe | Intraday |
| Recommendation | BUY STOP |
| Entry Point | 1.0025, 1.0035 |
| Take Profit | 1.0082, 1.0100 |
| Stop Loss | 0.9980, 0.9990 |
| Key Levels | 0.9850, 0.9894, 0.9940, 0.9967, 1.0000, 1.0020, 1.0054, 1.0082, 1.0100 |
| Alternative scenario | |
|---|---|
| Recommendation | SELL STOP |
| Entry Point | 0.9960 |
| Take Profit | 0.9875, 0.9850 |
| Stop Loss | 1.0020 |
| Key Levels | 0.9850, 0.9894, 0.9940, 0.9967, 1.0000, 1.0020, 1.0054, 1.0082, 1.0100 |
Current trend
The US dollar, paired with the Swiss franc, remains at the record highs, updated on May 10.
Published on Thursday, weekly data from the US labor market were ambiguous. The initial jobless claims increased from 211K to 222K, and the number of continuing claims decreased from 1,794 to 1,707 million.
Investors are following the progress of the second round of US-China trade talks in Washington. Probably, this round will not bring any significant results, as well as the first one, held in Beijing.
On Friday, investors are waiting for speeches by FRS members Lael Brainard and Loretta Meister, who can comment on the state and prospects of the US economy and the further actions of the regulator.
Support and resistance
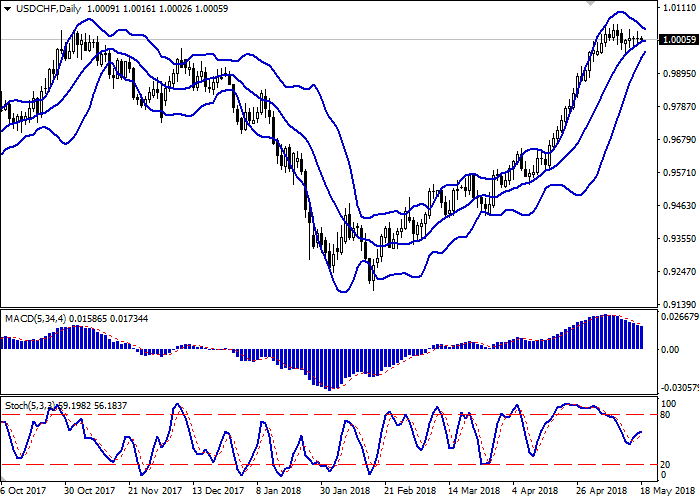
Bollinger bands on the daily chart are turned sideways. The price range is narrowing, reflecting the mixed trades in recent days.
The MACD indicator decreases, keeping the sell signal (the histogram is below the signal line).
Stochastics, on the contrary, shows an upward trend.
To open new trading positions, it is necessary to wait for clarification of the situation on the market.
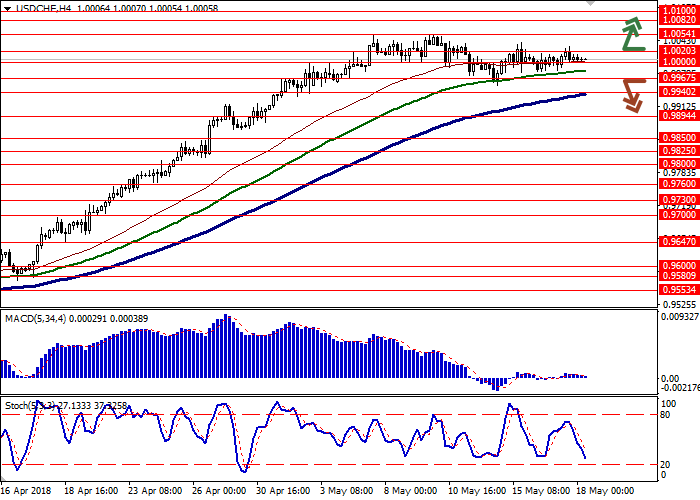
Resistance levels: 1.0020, 1.0054, 1.0082, 1.0100.
Support levels: 1.0000, 0.9967, 0.9940, 0.9894, 0.9850.


Trading tips
To open long positions, you can rely on the breakout of the zone 1.0020-1.0030. Take profit should be set at 1.0082 or 1.0100. Stop loss will be in the range of 0.9980-0.9990. Term of realization: 2-3 days.
The development of “bearish” dynamics with a breakdown of 0.9967 may become a signal for new sales with a target in the area of 0.9875-0.9850. The stop loss is 1.0020. Term of realization: 2-3 days.
The US dollar, paired with the Swiss franc, remains at the record highs, updated on May 10.
Published on Thursday, weekly data from the US labor market were ambiguous. The initial jobless claims increased from 211K to 222K, and the number of continuing claims decreased from 1,794 to 1,707 million.
Investors are following the progress of the second round of US-China trade talks in Washington. Probably, this round will not bring any significant results, as well as the first one, held in Beijing.
On Friday, investors are waiting for speeches by FRS members Lael Brainard and Loretta Meister, who can comment on the state and prospects of the US economy and the further actions of the regulator.
Support and resistance
Bollinger bands on the daily chart are turned sideways. The price range is narrowing, reflecting the mixed trades in recent days.
The MACD indicator decreases, keeping the sell signal (the histogram is below the signal line).
Stochastics, on the contrary, shows an upward trend.
To open new trading positions, it is necessary to wait for clarification of the situation on the market.
Resistance levels: 1.0020, 1.0054, 1.0082, 1.0100.
Support levels: 1.0000, 0.9967, 0.9940, 0.9894, 0.9850.


Trading tips
To open long positions, you can rely on the breakout of the zone 1.0020-1.0030. Take profit should be set at 1.0082 or 1.0100. Stop loss will be in the range of 0.9980-0.9990. Term of realization: 2-3 days.
The development of “bearish” dynamics with a breakdown of 0.9967 may become a signal for new sales with a target in the area of 0.9875-0.9850. The stop loss is 1.0020. Term of realization: 2-3 days.


No comments:
Write comments