
USD/JPY: general review
10 May 2018, 09:53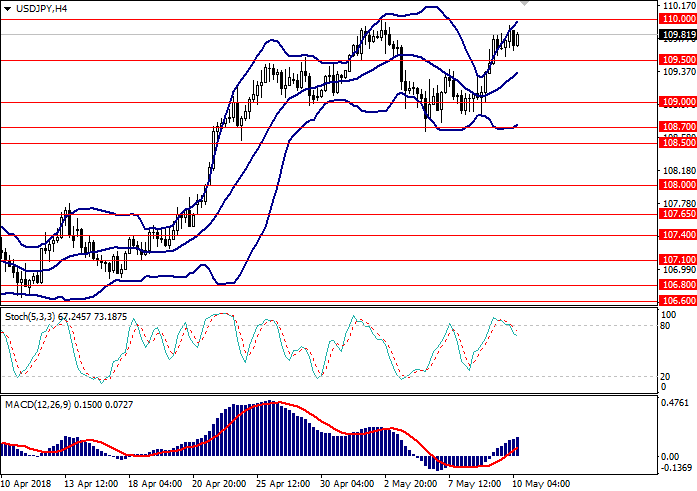
| Scenario | |
|---|---|
| Timeframe | Intraday |
| Recommendation | BUY |
| Entry Point | 109.87 |
| Take Profit | 110.50 |
| Stop Loss | 109.50 |
| Key Levels | 108.00, 108.50, 108.70, 109.00, 109.50, 110.00, 110.50, 111.00 |
| Alternative scenario | |
|---|---|
| Recommendation | SELL STOP |
| Entry Point | 108.50 |
| Take Profit | 108.00 |
| Stop Loss | 108.80 |
| Key Levels | 108.00, 108.50, 108.70, 109.00, 109.50, 110.00, 110.50, 111.00 |
Current trend
USD strengthened against JPY yesterday amid rising of US government bond yields above 3%.
Wednesday’s Japanese statistic was mixed. Labor Cash Earnings grew to the level of 2.1% in March from 1.0% in the previous month. Composite Index of Leading Indicators decreased to 105.0 points in March from 105.9 points in the previous period. Composite Index of Coincident indicators has met the expectations and reached 116.4 points in March.
The slowdown in the growth of Consumer Price Index Excluding Food & Energy in the US was a constraining factor for the growth of the pair: the indicator fell to 2.3% in April against 2.7% in the previous month, while growth was expected to be at least 2.4%.
Today, JPY gained support from an increase in Japan's foreign trade balance in March, and growth in bank lending in April, but this consolidation was temporary.
Today, traders should pay attention to the release of data on the change in the jobless claims number (14:30 GMT+2), as well as Consumer Price Index Excluding Food & Energy (14:30 GMT+2) in the US. The market is expected to be highly volatile.
Support and resistance
On the H4 chart, the pair grows along the upper line of Bollinger Bands, the price range is widened, which indicates a possible continuation of the uptrend. MACD histogram is in the positive area, the signal line crosses the zero mark and the histogram body from below, signaling the opening of long orders.
Support levels: 109.50, 109.00, 108.70, 108.50, 108.00.
Resistance levels: 110.00, 110.50, 111.00.

Trading tips
Buy orders may be opened from the current level with the target at 110.50 and stop-loss at 109.50 mark.
Short positions may be opened from the level of 108.50 with the target at 108.00 and stop-loss at 108.80.
Implementation period: 1-3 days.
USD strengthened against JPY yesterday amid rising of US government bond yields above 3%.
Wednesday’s Japanese statistic was mixed. Labor Cash Earnings grew to the level of 2.1% in March from 1.0% in the previous month. Composite Index of Leading Indicators decreased to 105.0 points in March from 105.9 points in the previous period. Composite Index of Coincident indicators has met the expectations and reached 116.4 points in March.
The slowdown in the growth of Consumer Price Index Excluding Food & Energy in the US was a constraining factor for the growth of the pair: the indicator fell to 2.3% in April against 2.7% in the previous month, while growth was expected to be at least 2.4%.
Today, JPY gained support from an increase in Japan's foreign trade balance in March, and growth in bank lending in April, but this consolidation was temporary.
Today, traders should pay attention to the release of data on the change in the jobless claims number (14:30 GMT+2), as well as Consumer Price Index Excluding Food & Energy (14:30 GMT+2) in the US. The market is expected to be highly volatile.
Support and resistance
On the H4 chart, the pair grows along the upper line of Bollinger Bands, the price range is widened, which indicates a possible continuation of the uptrend. MACD histogram is in the positive area, the signal line crosses the zero mark and the histogram body from below, signaling the opening of long orders.
Support levels: 109.50, 109.00, 108.70, 108.50, 108.00.
Resistance levels: 110.00, 110.50, 111.00.
Trading tips
Buy orders may be opened from the current level with the target at 110.50 and stop-loss at 109.50 mark.
Short positions may be opened from the level of 108.50 with the target at 108.00 and stop-loss at 108.80.
Implementation period: 1-3 days.


No comments:
Write comments