
NZD/USD: New Zealand dollar remains under pressure
10 May 2018, 10:24
| Scenario | |
|---|---|
| Timeframe | Intraday |
| Recommendation | BUY STOP |
| Entry Point | 0.6960 |
| Take Profit | 0.7000, 0.7036, 0.7051 |
| Stop Loss | 0.6900 |
| Key Levels | 0.6850, 0.6880, 0.6913, 0.6952, 0.6982, 0.7000, 0.7036 |
| Alternative scenario | |
|---|---|
| Recommendation | SELL STOP |
| Entry Point | 0.6905, 0.6890 |
| Take Profit | 0.6850, 0.6820, 0.6800 |
| Stop Loss | 0.6950, 0.6960 |
| Key Levels | 0.6850, 0.6880, 0.6913, 0.6952, 0.6982, 0.7000, 0.7036 |
Current trend
NZD showed a slight increase against USD on Wednesday, but returned to an active decline today, responding to the publication of the RBNZ meeting results and comments of the regulator's new head Adrian Orr.
As expected, the RBNZ kept the interest rate unchanged at 1.75% for the 19th consecutive month. Investors were slightly disappointed with Orr's cautious position on possible further tightening of monetary policy. The Central Bank noted moderate economic growth and employment in the country, but pointed to a rather low inflation, which continues to be below the target level of 2%. The rate growth to 2%, according to the regulator, is possible in Q1 2020. Inflation should reach the target levels around the same time.
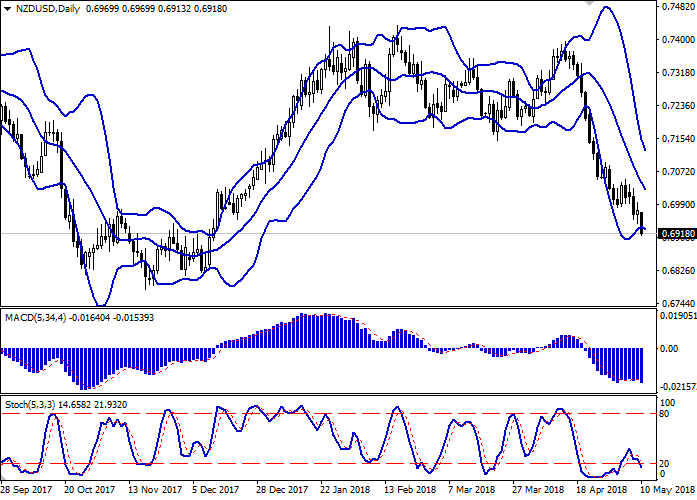
Support and resistance
Bollinger Bands show a stable decrease in D1 chart. The price range, after a sharp contraction, may again expand, but does not conform to the development of the "bearish" trend at the moment.
MACD reversed downwards having formed a "bearish" signal (located below the signal line).
Stochastic shows a similar dynamics and approaches its minimum marks, which signals the oversold NZD in the short or ultra-short term.
At the moment, the indicators do not contradict the further development of the "bearish" trend in the short term. One should wait with opening new sales because of the instrument oversold.
Resistance levels: 0.6952, 0.6982, 0.7000, 0.7036.
Support levels: 0.6913, 0.6880, 0.6850.
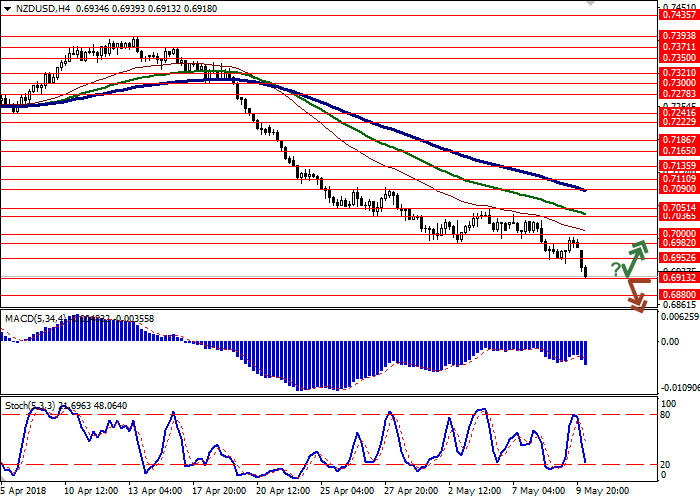
Trading tips
To open long positions, one can rely on the rebound from the support level of 0.6913, with the subsequent breakout of the 0.6952 mark. Take-profit – 0.7000, 0.7036–0.7051. Stop-loss – 0.6900. Implementation period: 1-3 days.
A breakdown of the level of 0.6913, 0.6900 may be a signal to further sales with targets at 0.6850, 0.6820–0.6800 marks. Stop-loss — 0.6950 or 0.6960. Implementation period: 2-3 days.
NZD showed a slight increase against USD on Wednesday, but returned to an active decline today, responding to the publication of the RBNZ meeting results and comments of the regulator's new head Adrian Orr.
As expected, the RBNZ kept the interest rate unchanged at 1.75% for the 19th consecutive month. Investors were slightly disappointed with Orr's cautious position on possible further tightening of monetary policy. The Central Bank noted moderate economic growth and employment in the country, but pointed to a rather low inflation, which continues to be below the target level of 2%. The rate growth to 2%, according to the regulator, is possible in Q1 2020. Inflation should reach the target levels around the same time.
Support and resistance
Bollinger Bands show a stable decrease in D1 chart. The price range, after a sharp contraction, may again expand, but does not conform to the development of the "bearish" trend at the moment.
MACD reversed downwards having formed a "bearish" signal (located below the signal line).
Stochastic shows a similar dynamics and approaches its minimum marks, which signals the oversold NZD in the short or ultra-short term.
At the moment, the indicators do not contradict the further development of the "bearish" trend in the short term. One should wait with opening new sales because of the instrument oversold.
Resistance levels: 0.6952, 0.6982, 0.7000, 0.7036.
Support levels: 0.6913, 0.6880, 0.6850.
Trading tips
To open long positions, one can rely on the rebound from the support level of 0.6913, with the subsequent breakout of the 0.6952 mark. Take-profit – 0.7000, 0.7036–0.7051. Stop-loss – 0.6900. Implementation period: 1-3 days.
A breakdown of the level of 0.6913, 0.6900 may be a signal to further sales with targets at 0.6850, 0.6820–0.6800 marks. Stop-loss — 0.6950 or 0.6960. Implementation period: 2-3 days.


No comments:
Write comments