
USD/CHF: the dollar is growing
10 May 2018, 10:35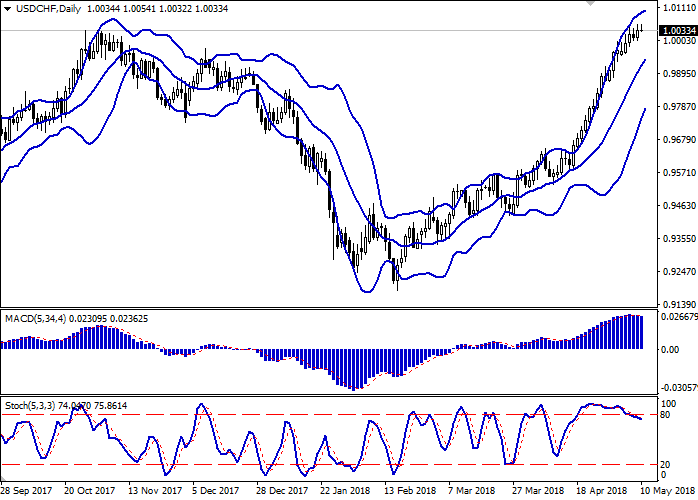
| Scenario | |
|---|---|
| Timeframe | Intraday |
| Recommendation | BUY STOP |
| Entry Point | 1.0060 |
| Take Profit | 1.0100, 1.0120 |
| Stop Loss | 1.0010 |
| Key Levels | 0.9940, 0.9967, 1.0000, 1.0020, 1.0054, 1.0082, 1.0100 |
| Alternative scenario | |
|---|---|
| Recommendation | SELL STOP |
| Entry Point | 1.0010, 0.9990 |
| Take Profit | 0.9940, 0.9920, 0.9900 |
| Stop Loss | 1.0050, 1.0070 |
| Key Levels | 0.9940, 0.9967, 1.0000, 1.0020, 1.0054, 1.0082, 1.0100 |
Current trend
USD is growing against CHF and renewing highs since May 2017, supported by the growth of 10-years treasury bonds’ yield, while the franc is reacting negatively to the development of the political crisis in Italy.
Today the pair is trading in different directions, waiting for the new drivers to appear. European exchanges are closed due to Ascension of Jesus holidays, so the investors are focused on US and UK publications: American April Consumer Price Index and Monthly Budget Statement, and BoE Interest Rate Decision.
Support and resistance
On the daily chart, Bollinger Bands are steadily growing. The price range is narrowing from below, reflecting the intention of the instrument to reverse into flat and consolidate around current levels. MACD is slightly going down, keeping a weak sell signal (the histogram is below the signal line). Stochastic is going down, stepping off its highs, but is still reflecting that USD is overbought in the short and very short term.
The formation of a correctional decrease in the short term at the end of the current week is possible.
Resistance levels: 1.0054, 1.0082, 1.0100.
Support levels: 1.0020, 1.0000, 0.9967, 0.9940.
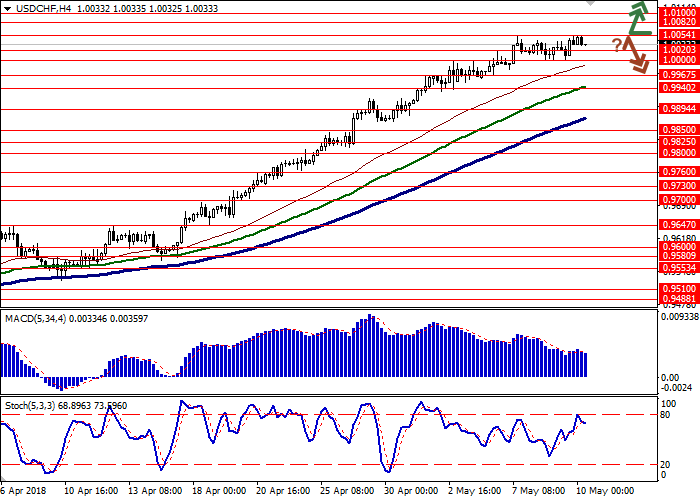

Trading tips
Long positions can be opened after the breakout of the level 1.0054 with the targets at 1.0100–1.0120 and stop loss 1.0010. Implementation period: 1–2 days.
Short positions can be opened after the rebound at the level of 1.0054 and the breakdown of the levels of 1.0020–1.0000 with the targets at 0.9940 or 0.9920–0.9900 and stop loss 1.0050–1.0070. Implementation period: 2–3 days.
USD is growing against CHF and renewing highs since May 2017, supported by the growth of 10-years treasury bonds’ yield, while the franc is reacting negatively to the development of the political crisis in Italy.
Today the pair is trading in different directions, waiting for the new drivers to appear. European exchanges are closed due to Ascension of Jesus holidays, so the investors are focused on US and UK publications: American April Consumer Price Index and Monthly Budget Statement, and BoE Interest Rate Decision.
Support and resistance
On the daily chart, Bollinger Bands are steadily growing. The price range is narrowing from below, reflecting the intention of the instrument to reverse into flat and consolidate around current levels. MACD is slightly going down, keeping a weak sell signal (the histogram is below the signal line). Stochastic is going down, stepping off its highs, but is still reflecting that USD is overbought in the short and very short term.
The formation of a correctional decrease in the short term at the end of the current week is possible.
Resistance levels: 1.0054, 1.0082, 1.0100.
Support levels: 1.0020, 1.0000, 0.9967, 0.9940.
Trading tips
Long positions can be opened after the breakout of the level 1.0054 with the targets at 1.0100–1.0120 and stop loss 1.0010. Implementation period: 1–2 days.
Short positions can be opened after the rebound at the level of 1.0054 and the breakdown of the levels of 1.0020–1.0000 with the targets at 0.9940 or 0.9920–0.9900 and stop loss 1.0050–1.0070. Implementation period: 2–3 days.


No comments:
Write comments