
USD/JPY: general review
04 May 2018, 15:48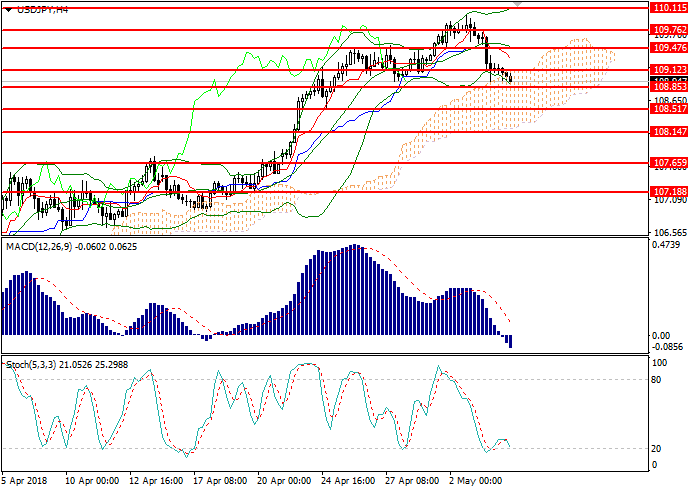
| Scenario | |
|---|---|
| Timeframe | Intraday |
| Recommendation | SELL |
| Entry Point | 108.68 |
| Take Profit | 108.15 |
| Stop Loss | 109.15 |
| Key Levels | 107.18, 107.65, 108.14, 108.51, 108.85, 109.12, 109.47, 109.76, 110.11, 110.39, 110.80 |
| Alternative scenario | |
|---|---|
| Recommendation | BUY STOP |
| Entry Point | 109.20 |
| Take Profit | 109.65 |
| Stop Loss | 108.90 |
| Key Levels | 107.18, 107.65, 108.14, 108.51, 108.85, 109.12, 109.47, 109.76, 110.11, 110.39, 110.80 |
Current trend
Yesterday the pair substantially fell amid a publication of weak macroeconomic statistics in the US. Data on the ISM Non-Manufacturing PMI came out worse than expectations, while quarterly figures on the Nonfarm Productivity and Unit Labour Cost showed slower than expected growth as well. In addition, the results of the latest Fed meeting that disappointed investors continue having negative effect on the American currency.
The Japanese market is closed on the last trading days of this week.
Support and resistance
On the 4-hour chart, the instrument is trading near the lower line of the Bollinger Bands. The indicator is turning horizontally while the price range is widening, which suggests a fall continuation. The MACD histogram is near the zero line, having formed a sell signal. The Stochastic is about to enter the oversold zone.
Support levels: 108.85, 108.51, 108.14, 107.65, 107.18.
Resistance levels: 109.12, 109.47, 109.76, 110.11, 110.39, 110.80.

Trading tips
Short positions can be opened below the level of 108.80 with the target at 108.15 and stop-loss at 109.15. Validity – 1-2 days.
Long positions can be opened above the level of 109.15 with the target at 109.65 and stop-loss at 108.90. Validity – 1-2 days.
Yesterday the pair substantially fell amid a publication of weak macroeconomic statistics in the US. Data on the ISM Non-Manufacturing PMI came out worse than expectations, while quarterly figures on the Nonfarm Productivity and Unit Labour Cost showed slower than expected growth as well. In addition, the results of the latest Fed meeting that disappointed investors continue having negative effect on the American currency.
The Japanese market is closed on the last trading days of this week.
Support and resistance
On the 4-hour chart, the instrument is trading near the lower line of the Bollinger Bands. The indicator is turning horizontally while the price range is widening, which suggests a fall continuation. The MACD histogram is near the zero line, having formed a sell signal. The Stochastic is about to enter the oversold zone.
Support levels: 108.85, 108.51, 108.14, 107.65, 107.18.
Resistance levels: 109.12, 109.47, 109.76, 110.11, 110.39, 110.80.
Trading tips
Short positions can be opened below the level of 108.80 with the target at 108.15 and stop-loss at 109.15. Validity – 1-2 days.
Long positions can be opened above the level of 109.15 with the target at 109.65 and stop-loss at 108.90. Validity – 1-2 days.


No comments:
Write comments