
USD/JPY: the dollar is prone to correction
07 May 2018, 09:30
| Scenario | |
|---|---|
| Timeframe | Intraday |
| Recommendation | BUY STOP |
| Entry Point | 109.30 |
| Take Profit | 109.76, 110.00 |
| Stop Loss | 108.90, 108.80 |
| Key Levels | 108.00, 108.26, 108.52, 108.94, 109.25, 109.52, 109.76, 110.00 |
| Alternative scenario | |
|---|---|
| Recommendation | SELL STOP |
| Entry Point | 108.60 |
| Take Profit | 108.00, 107.80 |
| Stop Loss | 109.00, 109.20 |
| Key Levels | 108.00, 108.26, 108.52, 108.94, 109.25, 109.52, 109.76, 110.00 |
Current trend
The US dollar showed mixed dynamics against the Japanese yen on Friday, updating local lows since April 24. Closer to the end of the afternoon session, the instrument traded in an upward direction, which was due to the US labor market report publication, which, although not meeting all expectations of the market, still testified in favor of further tightening of the Fed's monetary policy.
Today, the pair is trading in mixed directions, and investors are waiting for comments from the Fed's representatives, Raphael Bostic, Robert Kaplan and Charles Evans. In addition, traders analyze published minutes of the Bank of Japan meeting on monetary policy.
Support and resistance
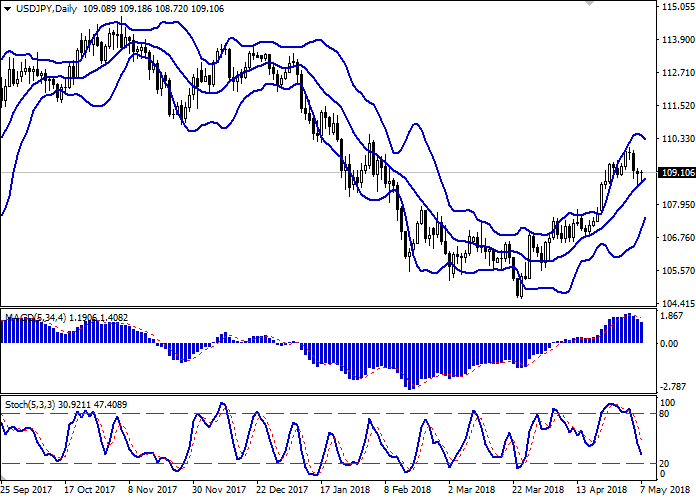
The Bollinger Bands in D1 chart show moderate growth. The price range is narrowing, reflecting the appearance of flat dynamics of trading in the short and ultra-short term.
MACD reversed downwards having formed a strong sell signal (histogram is located below the signal line).
Stochastic shows a similar dynamics, but the indicator line is already approaching its minimum marks, which indicates the possible oversold dollar in the ultra-short term.
Consider development of correctional decline in the short term.
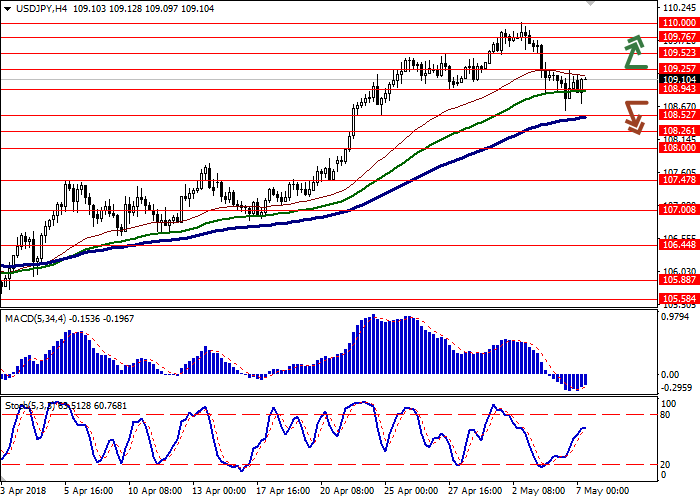
Resistance levels: 109.25, 109.52, 109.76, 110.00.
Support levels: 108.94, 108.52, 108.26, 108.00.
Trading tips
To open long positions one can rely on the breakout of the level of 109.25 if technical indicators confirm it. Take-profit – 109.76 or 110.00. Stop-loss — 108.90 or 108.80. Implementation period: 2-3 days.
The development of "bearish" dynamics with the breakdown of the level of 108.70 or 108.52 may become a signal for further sales with target at 108.00 or 107.80. Stop-loss — 109.00 or 109.20. Implementation period: 2-3 days.
The US dollar showed mixed dynamics against the Japanese yen on Friday, updating local lows since April 24. Closer to the end of the afternoon session, the instrument traded in an upward direction, which was due to the US labor market report publication, which, although not meeting all expectations of the market, still testified in favor of further tightening of the Fed's monetary policy.
Today, the pair is trading in mixed directions, and investors are waiting for comments from the Fed's representatives, Raphael Bostic, Robert Kaplan and Charles Evans. In addition, traders analyze published minutes of the Bank of Japan meeting on monetary policy.
Support and resistance
The Bollinger Bands in D1 chart show moderate growth. The price range is narrowing, reflecting the appearance of flat dynamics of trading in the short and ultra-short term.
MACD reversed downwards having formed a strong sell signal (histogram is located below the signal line).
Stochastic shows a similar dynamics, but the indicator line is already approaching its minimum marks, which indicates the possible oversold dollar in the ultra-short term.
Consider development of correctional decline in the short term.
Resistance levels: 109.25, 109.52, 109.76, 110.00.
Support levels: 108.94, 108.52, 108.26, 108.00.
Trading tips
To open long positions one can rely on the breakout of the level of 109.25 if technical indicators confirm it. Take-profit – 109.76 or 110.00. Stop-loss — 108.90 or 108.80. Implementation period: 2-3 days.
The development of "bearish" dynamics with the breakdown of the level of 108.70 or 108.52 may become a signal for further sales with target at 108.00 or 107.80. Stop-loss — 109.00 or 109.20. Implementation period: 2-3 days.


No comments:
Write comments