USD/CAD: the price of the instrument is declining
17 May 2018, 10:33
| Scenario | |
|---|---|
| Timeframe | Intraday |
| Recommendation | BUY STOP |
| Entry Point | 1.2805 |
| Take Profit | 1.2860, 1.2900 |
| Stop Loss | 1.2750, 1.2744 |
| Key Levels | 1.2540, 1.2622, 1.2700, 1.2744, 1.2800, 1.2860, 1.2900, 1.2947 |
| Alternative scenario | |
|---|---|
| Recommendation | SELL STOP |
| Entry Point | 1.2740 |
| Take Profit | 1.2650 |
| Stop Loss | 1.2780, 1.2790 |
| Key Levels | 1.2540, 1.2622, 1.2700, 1.2744, 1.2800, 1.2860, 1.2900, 1.2947 |
Current trend
USD declined significantly against CAD on Wednesday, neutralizing the growth results the day before.
Wednesday’s US building data were poor. April Housing Starts decreased from 1.336M to 1.287M, Building Permits fell from 1.377M to 1.352M. However, in general, the trend is upward.
In the middle term, international tension can weaken USD: planned for the next month meeting of US and DPRK can be canceled. On Wednesday, it was reported by Deputy of Foreign Minister of North Korea Kim Kye Gwan. The Korean party is not satisfied by US demand of unilateral disarmament of DPRK and new military exercises of USA and South Korea.
Support and resistance
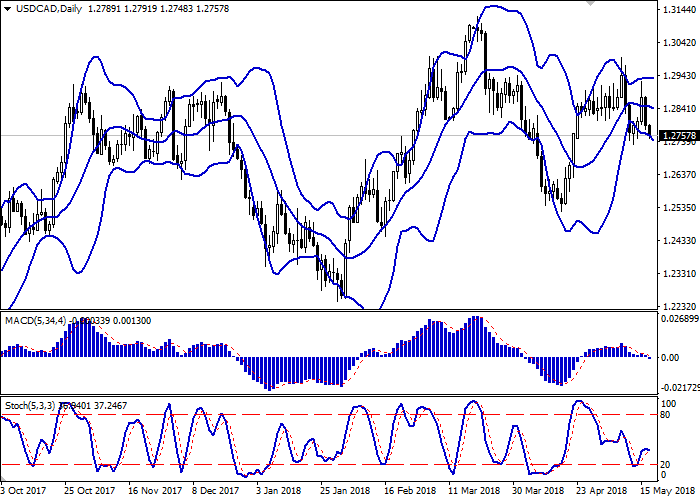
Bollinger Bands in D1 chart demonstrate flat dynamics. The price range expands from below, making way for new local lows for the "bears".
MACD is going down preserving a moderate sell signal (histogram is located below the signal line). In addition, the indicator is trying to gain a foothold below the zero mark at the moment.
Stochastic, after a brief period of growth, reverses in the direction of decline. The indicator is located not far from the mark "20", which is a formal oversold limit of the instrument.
Technical indicators do not contradict the further development of the "bearish" trend in the short or ultra-short term.
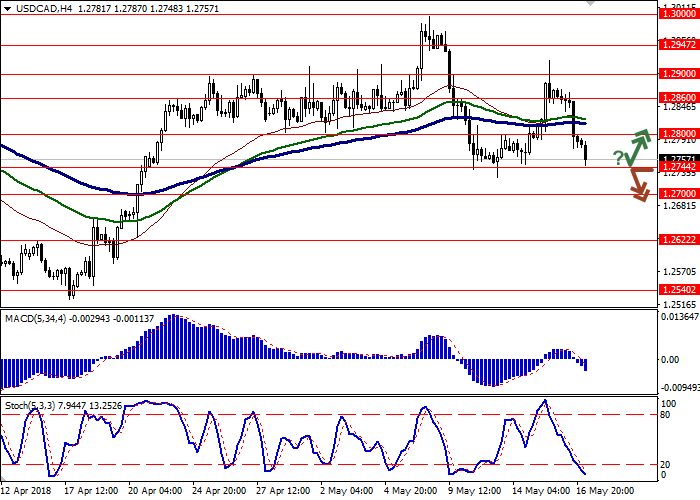
Resistance levels: 1.2800, 1.2860, 1.2900, 1.2947.
Support levels: 1.2744, 1.2700, 1.2622, 1.2540.


Trading tips
To open long positions, one can rely on the rebound from the support level of 1.2744, with the subsequent breakout of the 1.2800 mark. Take-profit – 1.2860 or 1.2900. Stop-loss – 1.2750–1.2744. Implementation period: 2-3 days.
The breakdown of 1.2744 mark may serve as a signal to further sales with the target at 1.2650. Stop-loss – 1.2780–1.2790. Implementation period: 2-3 days.
USD declined significantly against CAD on Wednesday, neutralizing the growth results the day before.
Wednesday’s US building data were poor. April Housing Starts decreased from 1.336M to 1.287M, Building Permits fell from 1.377M to 1.352M. However, in general, the trend is upward.
In the middle term, international tension can weaken USD: planned for the next month meeting of US and DPRK can be canceled. On Wednesday, it was reported by Deputy of Foreign Minister of North Korea Kim Kye Gwan. The Korean party is not satisfied by US demand of unilateral disarmament of DPRK and new military exercises of USA and South Korea.
Support and resistance
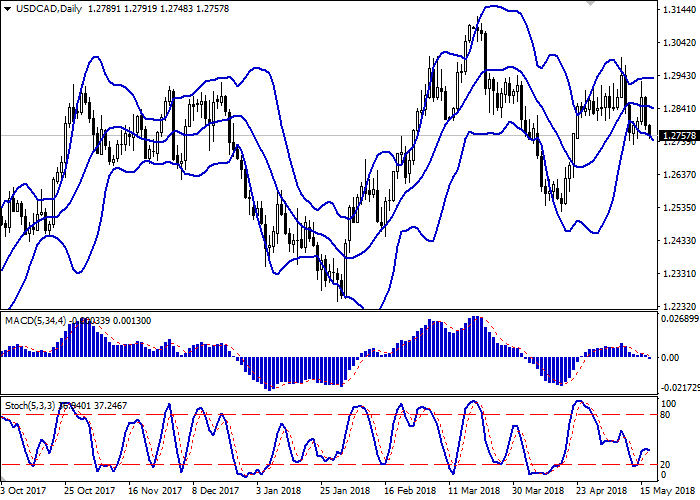
Bollinger Bands in D1 chart demonstrate flat dynamics. The price range expands from below, making way for new local lows for the "bears".
MACD is going down preserving a moderate sell signal (histogram is located below the signal line). In addition, the indicator is trying to gain a foothold below the zero mark at the moment.
Stochastic, after a brief period of growth, reverses in the direction of decline. The indicator is located not far from the mark "20", which is a formal oversold limit of the instrument.
Technical indicators do not contradict the further development of the "bearish" trend in the short or ultra-short term.
Resistance levels: 1.2800, 1.2860, 1.2900, 1.2947.
Support levels: 1.2744, 1.2700, 1.2622, 1.2540.


Trading tips
To open long positions, one can rely on the rebound from the support level of 1.2744, with the subsequent breakout of the 1.2800 mark. Take-profit – 1.2860 or 1.2900. Stop-loss – 1.2750–1.2744. Implementation period: 2-3 days.
The breakdown of 1.2744 mark may serve as a signal to further sales with the target at 1.2650. Stop-loss – 1.2780–1.2790. Implementation period: 2-3 days.


No comments:
Write comments