USD/JPY: the pair is consolidating
17 May 2018, 10:51
| Scenario | |
|---|---|
| Timeframe | Intraday |
| Recommendation | BUY |
| Entry Point | 110.58 |
| Take Profit | 111.00 |
| Stop Loss | 110.10 |
| Key Levels | 109.25, 109.52, 109.76, 110.00, 110.43, 110.70, 111.00 |
| Alternative scenario | |
|---|---|
| Recommendation | SELL STOP |
| Entry Point | 109.90 |
| Take Profit | 109.25, 109.00 |
| Stop Loss | 110.35 |
| Key Levels | 109.25, 109.52, 109.76, 110.00, 110.43, 110.70, 111.00 |
Current dynamics
The US dollar fell slightly against the Japanese yen on Wednesday, despite the publication of mixed macroeconomic statistics from Japan.
Q1 GDP fell to –0.2% from 0.4% in the previous period. Industrial Productions grew to 2.4% YoY in March from 2.2% in the previous month. MoM value grew to 1.4% in March from 1.2% in the previous month. Capacity Utilization fell to 0.5% in March from 1.3% in the previous month.
Today, data on the orders for engineering products in Japan are expected. In March, the indicator fell by 3.9% m/m and 2.4% y/y, which was significantly worse than analysts' expectations and last month's data.
Support and resistance
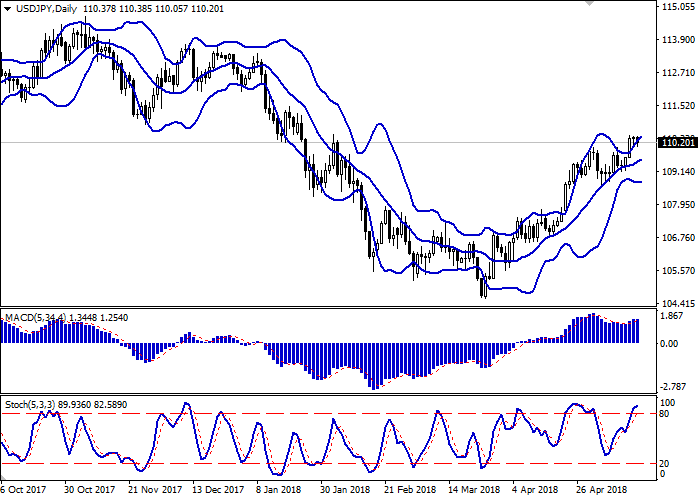
Bollinger bands on the daily chart are growing. The price range is expanding, but does not keep pace with the development of the "bullish" trend in the short term.
The MACD indicator gradually turns down, but keeps the previous buy signal (the histogram is above the signal line).
The Stochastic is approaching the overbought zone.
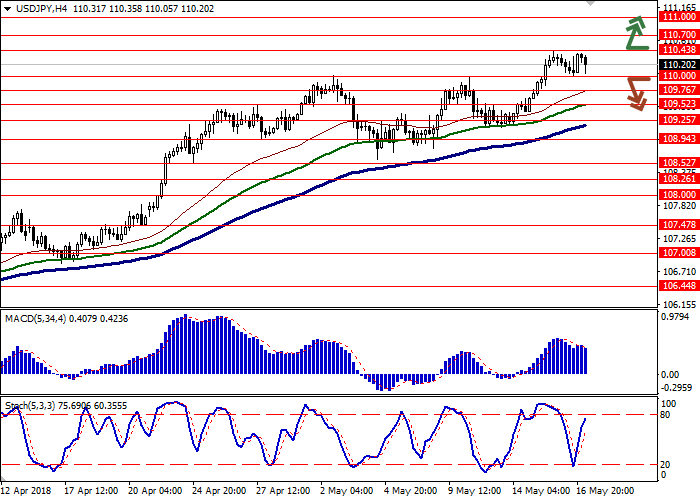
Resistance levels: 110.43, 110.70, 111.00.
Support levels: 110.00, 109.76, 109.52, 109.25.


Trading tips
To open long positions, you can rely on the breakout of 110.43. Take profit – 111.00. The stop loss is 110.10. Term of realization: 2-3 days.
The return of the "bearish" dynamics to the market with a breakdown of 110.00 can be a signal for sales with a targets at 109.25 and 109.00. Stop loss is 110.35. Term of realization: 2-3 days.
The US dollar fell slightly against the Japanese yen on Wednesday, despite the publication of mixed macroeconomic statistics from Japan.
Q1 GDP fell to –0.2% from 0.4% in the previous period. Industrial Productions grew to 2.4% YoY in March from 2.2% in the previous month. MoM value grew to 1.4% in March from 1.2% in the previous month. Capacity Utilization fell to 0.5% in March from 1.3% in the previous month.
Today, data on the orders for engineering products in Japan are expected. In March, the indicator fell by 3.9% m/m and 2.4% y/y, which was significantly worse than analysts' expectations and last month's data.
Support and resistance
Bollinger bands on the daily chart are growing. The price range is expanding, but does not keep pace with the development of the "bullish" trend in the short term.
The MACD indicator gradually turns down, but keeps the previous buy signal (the histogram is above the signal line).
The Stochastic is approaching the overbought zone.
Resistance levels: 110.43, 110.70, 111.00.
Support levels: 110.00, 109.76, 109.52, 109.25.


Trading tips
To open long positions, you can rely on the breakout of 110.43. Take profit – 111.00. The stop loss is 110.10. Term of realization: 2-3 days.
The return of the "bearish" dynamics to the market with a breakdown of 110.00 can be a signal for sales with a targets at 109.25 and 109.00. Stop loss is 110.35. Term of realization: 2-3 days.


No comments:
Write comments