
USD/CAD: the instrument recovers
14 May 2018, 10:01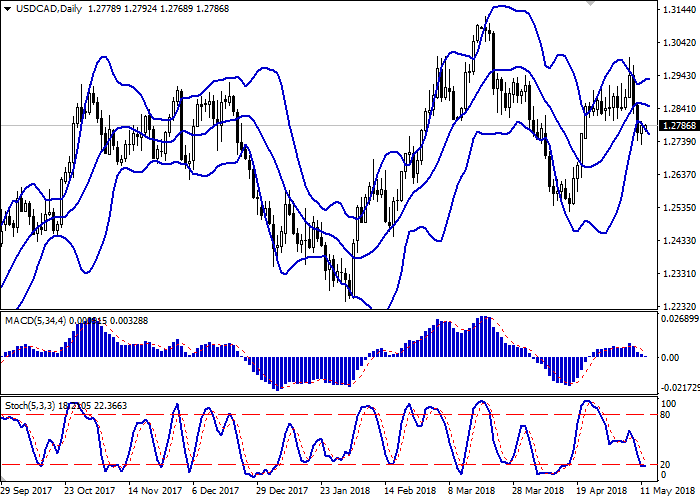
| Scenario | |
|---|---|
| Timeframe | Intraday |
| Recommendation | BUY STOP |
| Entry Point | 1.2810 |
| Take Profit | 1.2900 |
| Stop Loss | 1.2744 |
| Key Levels | 1.2540, 1.2622, 1.2700, 1.2744, 1.2800, 1.2860, 1.2900, 1.2947, 1.3000 |
| Alternative scenario | |
|---|---|
| Recommendation | SELL STOP |
| Entry Point | 1.2740 |
| Take Profit | 1.2650, 1.2622 |
| Stop Loss | 1.2800 |
| Key Levels | 1.2540, 1.2622, 1.2700, 1.2744, 1.2800, 1.2860, 1.2900, 1.2947, 1.3000 |
Current trend
USD showed moderate growth against CAD on May 11, partially winning back the losses of the two previous days. The growth of the instrument was facilitated by technical correction factors, as well as a weak report on the Canadian labor market in April.
The number of employed people in April fell by 1.1K jobs, while analysts had expected growth of 17.4K jobs. In March, employment growth amounted to 32.3K jobs. Participation rate in April fell from 65.5% to 65.4%, which was worse than analysts' expectations. At the same time, the overall unemployment rate remained at the previous level of 5.8%.
Support and resistance
Bollinger Bands in D1 chart demonstrate mixed dynamics. The price range widens from below, continuing to respond to the "bearish" momentum generated at the trading on May 9 and 10.
MACD is going down preserving a stable sell signal (histogram being located below the signal line). In addition, the indicator is trying to gain a foothold below the zero mark at the moment.
Stochastic reverses into the horizontal plane, being in the immediate vicinity of the "20" mark, which is the formal limit of oversoldness of the instrument.
Current readings of technical indicators remain uninformative and reflect the former "bearish" sentiment on the market. It is necessary to wait for clarification of the situation.
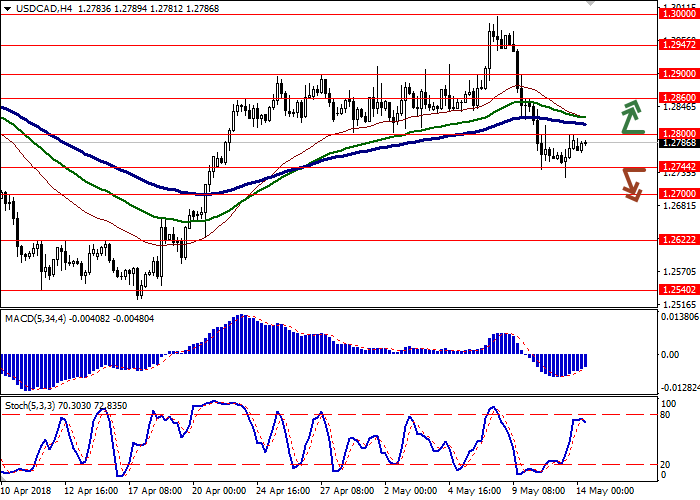
Resistance levels: 1.2800, 1.2860, 1.2900, 1.2947, 1.3000.
Support levels: 1.2744, 1.2700, 1.2622, 1.2540.

Trading tips
To open long positions one can rely on the breakout of the level of 1.2800, while maintaining "bullish" signals from technical indicators. Take-profit – 1.2900. Stop-loss – 1.2744. Implementation period: 2-3 days.
The return of "bearish" trend with the breakdown of the level of 1.2744 may become a signal for further sales with the targets at 1.2650, 1.2622. Stop-loss — 1.2800. Implementation period: 2-3 days.
USD showed moderate growth against CAD on May 11, partially winning back the losses of the two previous days. The growth of the instrument was facilitated by technical correction factors, as well as a weak report on the Canadian labor market in April.
The number of employed people in April fell by 1.1K jobs, while analysts had expected growth of 17.4K jobs. In March, employment growth amounted to 32.3K jobs. Participation rate in April fell from 65.5% to 65.4%, which was worse than analysts' expectations. At the same time, the overall unemployment rate remained at the previous level of 5.8%.
Support and resistance
Bollinger Bands in D1 chart demonstrate mixed dynamics. The price range widens from below, continuing to respond to the "bearish" momentum generated at the trading on May 9 and 10.
MACD is going down preserving a stable sell signal (histogram being located below the signal line). In addition, the indicator is trying to gain a foothold below the zero mark at the moment.
Stochastic reverses into the horizontal plane, being in the immediate vicinity of the "20" mark, which is the formal limit of oversoldness of the instrument.
Current readings of technical indicators remain uninformative and reflect the former "bearish" sentiment on the market. It is necessary to wait for clarification of the situation.
Resistance levels: 1.2800, 1.2860, 1.2900, 1.2947, 1.3000.
Support levels: 1.2744, 1.2700, 1.2622, 1.2540.
Trading tips
To open long positions one can rely on the breakout of the level of 1.2800, while maintaining "bullish" signals from technical indicators. Take-profit – 1.2900. Stop-loss – 1.2744. Implementation period: 2-3 days.
The return of "bearish" trend with the breakdown of the level of 1.2744 may become a signal for further sales with the targets at 1.2650, 1.2622. Stop-loss — 1.2800. Implementation period: 2-3 days.


No comments:
Write comments