
NZD/USD: the pair is traded sideways
08 May 2018, 10:03
| Scenario | |
|---|---|
| Timeframe | Intraday |
| Recommendation | BUY STOP |
| Entry Point | 0.7040, 0.7055 |
| Take Profit | 0.7100, 0.7135 |
| Stop Loss | 0.7000 |
| Key Levels | 0.6952, 0.6982, 0.7000, 0.7036, 0.7051, 0.7090, 0.7110 |
| Alternative scenario | |
|---|---|
| Recommendation | SELL STOP |
| Entry Point | 0.6990 |
| Take Profit | 0.6952, 0.6900 |
| Stop Loss | 0.7040 |
| Key Levels | 0.6952, 0.6982, 0.7000, 0.7036, 0.7051, 0.7090, 0.7110 |
Current trend
NZD fell against USD yesterday, which did not change the alignment of forces, even in the ultra-short term. As there was lack of macroeconomic data on Monday, investors focus on the previous publications from the US and New Zealand.
Today, the pair also trades ambiguously. NZD was supported insignificantly by publications from China, in particular, on the export growth by 12.9% YoY with the forecast of +6.3% YoY.
Traders are waiting for Thursday’s RBNZ meeting. Analysts do not forecast any changes in the monetary policy vector, as well as hints of its tightening in the near future. However, the final protocol will be commented by Adrian Orr, the new head of the regulator, which can have a significant impact on the trading dynamics.
Support and resistance
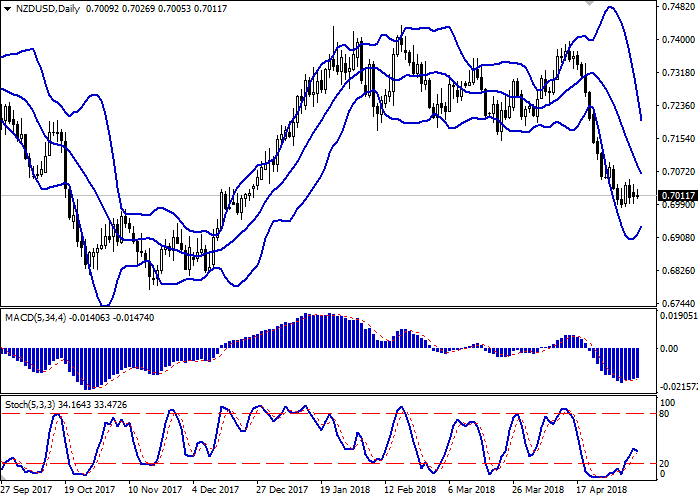
Bollinger Bands in D1 chart demonstrate a stable decrease. The price range is narrowing, reflecting the emergence of mixed dynamics in the short term.
MACD indicator is growing preserving a buy signal (the histogram is above the signal line).
Stochastic, after a brief period of growth, reverses in the direction of decline.
At the moment, the indicators do not contradict the development of the upward correction in the short term. Nevertheless, to open new positions it is better to wait for the appearance of additional signals.
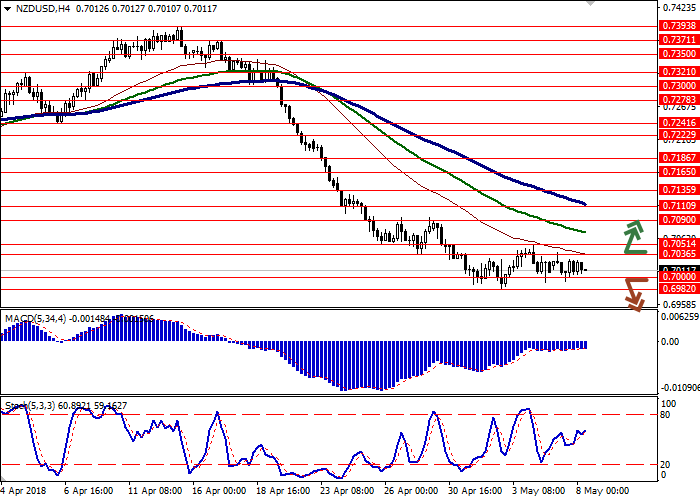
Resistance levels: 0.7036, 0.7051, 0.7090, 0.7110.
Support levels: 0.7000, 0.6982, 0.6952.
Trading tips
To open long positions, one can rely on the breakout of 0.7036 or 0.7051 marks, provided that the showings of technical indicators do not contradict the development of the "bullish" trend. Take-profit — 0.7100, 0.7135. Stop-loss should be placed no further than 0.7000. Implementation period: 2-3 days.
The breakdown of 0.7000 mark may serve as a signal to new sales with the targets at 0.6952 or 0.6900. Stop-loss — 0.7040. Implementation period: 2-3 days.
NZD fell against USD yesterday, which did not change the alignment of forces, even in the ultra-short term. As there was lack of macroeconomic data on Monday, investors focus on the previous publications from the US and New Zealand.
Today, the pair also trades ambiguously. NZD was supported insignificantly by publications from China, in particular, on the export growth by 12.9% YoY with the forecast of +6.3% YoY.
Traders are waiting for Thursday’s RBNZ meeting. Analysts do not forecast any changes in the monetary policy vector, as well as hints of its tightening in the near future. However, the final protocol will be commented by Adrian Orr, the new head of the regulator, which can have a significant impact on the trading dynamics.
Support and resistance
Bollinger Bands in D1 chart demonstrate a stable decrease. The price range is narrowing, reflecting the emergence of mixed dynamics in the short term.
MACD indicator is growing preserving a buy signal (the histogram is above the signal line).
Stochastic, after a brief period of growth, reverses in the direction of decline.
At the moment, the indicators do not contradict the development of the upward correction in the short term. Nevertheless, to open new positions it is better to wait for the appearance of additional signals.
Resistance levels: 0.7036, 0.7051, 0.7090, 0.7110.
Support levels: 0.7000, 0.6982, 0.6952.
Trading tips
To open long positions, one can rely on the breakout of 0.7036 or 0.7051 marks, provided that the showings of technical indicators do not contradict the development of the "bullish" trend. Take-profit — 0.7100, 0.7135. Stop-loss should be placed no further than 0.7000. Implementation period: 2-3 days.
The breakdown of 0.7000 mark may serve as a signal to new sales with the targets at 0.6952 or 0.6900. Stop-loss — 0.7040. Implementation period: 2-3 days.


No comments:
Write comments