
XAU/USD: the price is decreasing
08 May 2018, 10:13
| Scenario | |
|---|---|
| Timeframe | Intraday |
| Recommendation | BUY LIMIT |
| Entry Point | 1306.70 |
| Take Profit | 1312.48, 1315.00 |
| Stop Loss | 1301.40 |
| Key Levels | 1301.40, 1306.70, 1312.48, 1317.17, 1320.87, 1326.21, 1332.73 |
| Alternative scenario | |
|---|---|
| Recommendation | SELL STOP |
| Entry Point | 1306.55 |
| Take Profit | 1301.40, 1298.00 |
| Stop Loss | 1311.00 |
| Key Levels | 1301.40, 1306.70, 1312.48, 1317.17, 1320.87, 1326.21, 1332.73 |
Current trend
Yesterday gold prices were falling and stepped off the weekly highs. Poor US employment market Fridays’ release did not affect USD negatively, despite the expectations. The investors are positive about further USA Fed’s interest rate increase.
Today the pair is going down more actively, having almost no support from strong Chinese statistics. The traders are waiting for the head of the regulator Jerome Powell speech, where he can confirm the forecasts of the further monetary policy tightening in the country.
Support and resistance
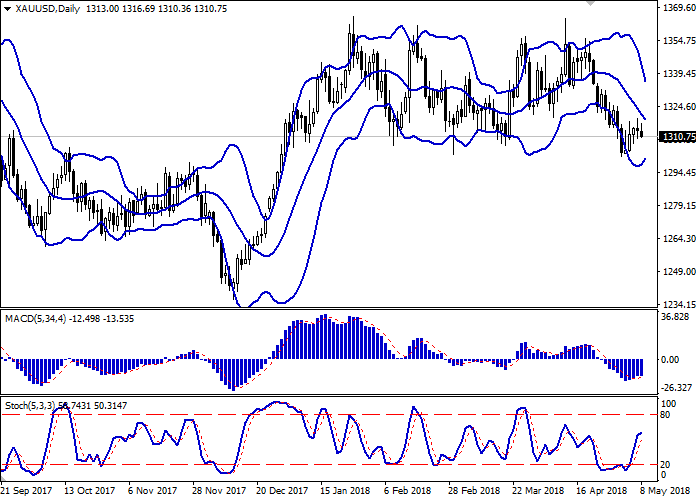
On the daily chart, Bollinger Bands are strongly falling. The price range is actively narrowing, reflecting the correctional growth appears in the short term. MACD is reversing downwards again, keeping a buy signal (the histogram is above the signal line). Stochastic has reacted to the “bearish” beginning of the week with only a slight slowing of its growth, but it can reverse into flat today.
The current technical indicators’ readings are mixed and do not form a clear signal. It is better to wait until the situation is clear.
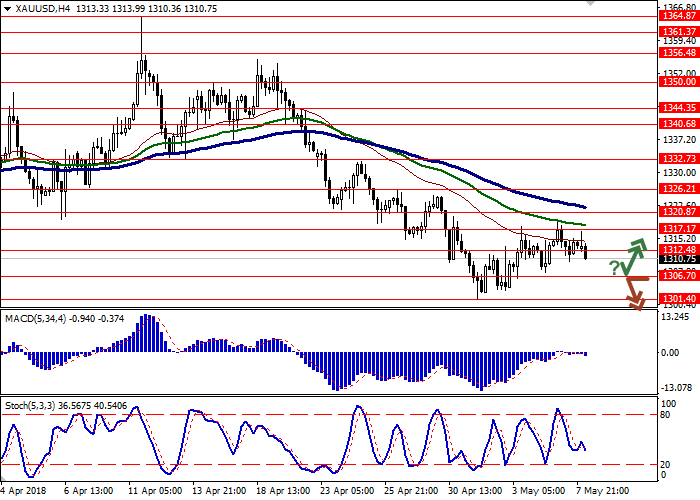
Resistance levels: 1317.17, 1320.87, 1326.21, 1332.73.
Support levels: 1312.48, 1306.70, 1301.40.
Trading tips
Long positions can be opened after the rebound at the level of 1306.70 with the target at 1312.48 or 1315.00 and stop loss 1301.40.
Short positions can be opened after the breakdown of the level 1306.70 with the target at 1301.40 or 1298.00 and stop loss 1311.00.
Implementation period: 1–2 days.
Yesterday gold prices were falling and stepped off the weekly highs. Poor US employment market Fridays’ release did not affect USD negatively, despite the expectations. The investors are positive about further USA Fed’s interest rate increase.
Today the pair is going down more actively, having almost no support from strong Chinese statistics. The traders are waiting for the head of the regulator Jerome Powell speech, where he can confirm the forecasts of the further monetary policy tightening in the country.
Support and resistance
On the daily chart, Bollinger Bands are strongly falling. The price range is actively narrowing, reflecting the correctional growth appears in the short term. MACD is reversing downwards again, keeping a buy signal (the histogram is above the signal line). Stochastic has reacted to the “bearish” beginning of the week with only a slight slowing of its growth, but it can reverse into flat today.
The current technical indicators’ readings are mixed and do not form a clear signal. It is better to wait until the situation is clear.
Resistance levels: 1317.17, 1320.87, 1326.21, 1332.73.
Support levels: 1312.48, 1306.70, 1301.40.
Trading tips
Long positions can be opened after the rebound at the level of 1306.70 with the target at 1312.48 or 1315.00 and stop loss 1301.40.
Short positions can be opened after the breakdown of the level 1306.70 with the target at 1301.40 or 1298.00 and stop loss 1311.00.
Implementation period: 1–2 days.


No comments:
Write comments