
Ethereum: technical analysis
24 May 2018, 13:39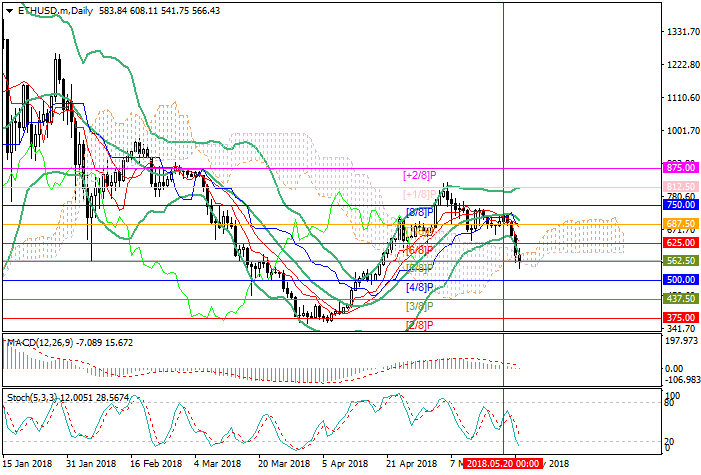
| Scenario | |
|---|---|
| Timeframe | Weekly |
| Recommendation | SELL |
| Entry Point | 562.50 |
| Take Profit | 500.00, 437.50 |
| Stop Loss | 590.00 |
| Key Levels | 437.50, 500.00, 562.50, 625.00, 687.50, 750.00 |
| Alternative scenario | |
|---|---|
| Recommendation | BUY STOP |
| Entry Point | 630.00 |
| Take Profit | 687.50, 750.00 |
| Stop Loss | 600.00 |
| Key Levels | 437.50, 500.00, 562.50, 625.00, 687.50, 750.00 |
Current trend
This week, Ether's quotes finally broke down the level of 678.50 (Murray [7/8]) and reached 562.50 mark (Murray [5/8]). Technical indicators point to the continuation of the downward trend. Bollinger Bands diverge, confirming a downward trend. Stochastic is pointing down. MACD histogram is about to move to the negative zone and to form a sell signal.
Thus, it is likely that the instrument will enter the central Murray channel and can reach levels of 500.00 (Murray [4/8]) and 437.00 (Murray [3/8]). In case of a breakout of 625.00 mark (Murray [6/8]), one should expect growth. In this case, the price can reach levels of 678.50 (Murray [7/8], the midline of Bollinger Bands) and 750.00 (Murray [8/8]).
Support and resistance
Support levels: 562.50, 500.00, 437.50.
Resistance levels: 625.00, 687.50, 750.00.

Trading tips
Short positions may be opened from the current level with targets at 500.00, 437.50 and stop-loss at 590.00.
Long positions may be opened above the level of 625.00 with targets at 687.50, 750.00 and stop-loss at 600.00.
Implementation time: 3-5 days.
This week, Ether's quotes finally broke down the level of 678.50 (Murray [7/8]) and reached 562.50 mark (Murray [5/8]). Technical indicators point to the continuation of the downward trend. Bollinger Bands diverge, confirming a downward trend. Stochastic is pointing down. MACD histogram is about to move to the negative zone and to form a sell signal.
Thus, it is likely that the instrument will enter the central Murray channel and can reach levels of 500.00 (Murray [4/8]) and 437.00 (Murray [3/8]). In case of a breakout of 625.00 mark (Murray [6/8]), one should expect growth. In this case, the price can reach levels of 678.50 (Murray [7/8], the midline of Bollinger Bands) and 750.00 (Murray [8/8]).
Support and resistance
Support levels: 562.50, 500.00, 437.50.
Resistance levels: 625.00, 687.50, 750.00.
Trading tips
Short positions may be opened from the current level with targets at 500.00, 437.50 and stop-loss at 590.00.
Long positions may be opened above the level of 625.00 with targets at 687.50, 750.00 and stop-loss at 600.00.
Implementation time: 3-5 days.


No comments:
Write comments