
Ethereum: general analysis
29 May 2018, 12:26
| Scenario | |
|---|---|
| Timeframe | Weekly |
| Recommendation | SELL STOP |
| Entry Point | 490.00 |
| Take Profit | 437.50, 375.00 |
| Stop Loss | 530.00 |
| Key Levels | 375.00, 437.50, 500.00, 562.50, 625.00, 687.50 |
| Alternative scenario | |
|---|---|
| Recommendation | BUY STOP |
| Entry Point | 562.50 |
| Take Profit | 625.00 |
| Stop Loss | 539.00 |
| Key Levels | 375.00, 437.50, 500.00, 562.50, 625.00, 687.50 |
Current trend
Last week, Ether prices decreased and are now testing a level of 500.00 (Murray's central level [4/8]). The driver of the weakening was the news that the US Department of Justice, together with the Commodity Futures Trading Commission, will investigate frauds of traders in the digital currency market. Investors anticipate the beginning of a new wave of restrictions, but this time the regulation may be subject not to companies’ activities, but to market participants.
On Monday, the price decline continued, according to experts, due to speculative reasons, as Bitfinex exchange significantly increased the trade volume, which could be due to the massive sale of Ether by a group of investors.
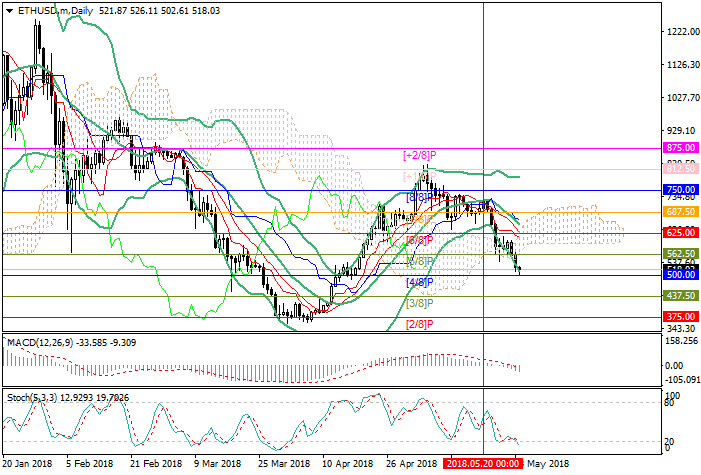
Support and resistance
Now the price is testing the level of 500.00 (Murray [4/8]) and in case of breakdown can go lower, to the level of 437.50 (Murray [3/8]) and 375.00 (Murray [2/8]). Otherwise, correction to area 625.00 (Murray [6/8], the middle line of Bollinger bands) is possible. Technical indicators generally reflect a fall. Bollinger bands are reversing downwards. MACD entered the negative zone. Stochastic is directed downwards but enters the oversold zone, which allows a correction.
Resistance levels: 562.50, 625.00, 687.50.
Support levels: 500.00, 437.50, 375.00.
Trading tips
Short positions can be opened after the price is set below the level of 500.00 with the targets at 437.50, 375.00 and stop loss around 530.00.
Long positions can be opened from the level of 562.50 with the target at 625.00 and stop loss 539.00.
Implementation period: 3–5 days.
Last week, Ether prices decreased and are now testing a level of 500.00 (Murray's central level [4/8]). The driver of the weakening was the news that the US Department of Justice, together with the Commodity Futures Trading Commission, will investigate frauds of traders in the digital currency market. Investors anticipate the beginning of a new wave of restrictions, but this time the regulation may be subject not to companies’ activities, but to market participants.
On Monday, the price decline continued, according to experts, due to speculative reasons, as Bitfinex exchange significantly increased the trade volume, which could be due to the massive sale of Ether by a group of investors.
Support and resistance
Now the price is testing the level of 500.00 (Murray [4/8]) and in case of breakdown can go lower, to the level of 437.50 (Murray [3/8]) and 375.00 (Murray [2/8]). Otherwise, correction to area 625.00 (Murray [6/8], the middle line of Bollinger bands) is possible. Technical indicators generally reflect a fall. Bollinger bands are reversing downwards. MACD entered the negative zone. Stochastic is directed downwards but enters the oversold zone, which allows a correction.
Resistance levels: 562.50, 625.00, 687.50.
Support levels: 500.00, 437.50, 375.00.
Trading tips
Short positions can be opened after the price is set below the level of 500.00 with the targets at 437.50, 375.00 and stop loss around 530.00.
Long positions can be opened from the level of 562.50 with the target at 625.00 and stop loss 539.00.
Implementation period: 3–5 days.


No comments:
Write comments