
Alphabet Inc. (GOOG/NASD): general analysis
29 May 2018, 11:46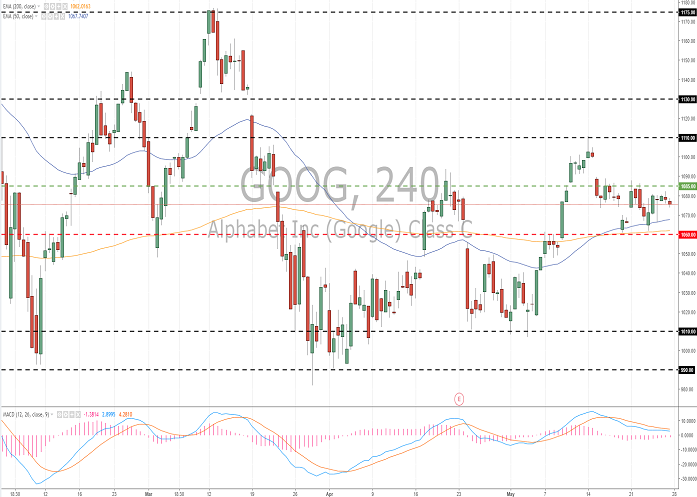
| Scenario | |
|---|---|
| Timeframe | Intraday |
| Recommendation | BUY STOP |
| Entry Point | 1085.10 |
| Take Profit | 1110.00, 1130.00, 1140.00 |
| Stop Loss | 1065.00 |
| Key Levels | 990.00, 1010.00, 1060.00, 1085.00, 1110.00, 1130.00 |
| Alternative scenario | |
|---|---|
| Recommendation | SELL STOP |
| Entry Point | 1059.90 |
| Take Profit | 1020.00, 1010.00 |
| Stop Loss | 1080.00 |
| Key Levels | 990.00, 1010.00, 1060.00, 1085.00, 1110.00, 1130.00 |
Current trend
Q1 2018 sales of smart Home Alphabet Inc have exceeded the sales of Echos Amazon.com for the first time. The volume of sales of Alphabet Inc. products grew by 36% YoY to 3.2 million devices against 19% YoY growth of Amazon.com to 2.5 million units.
Alphabet Inc. tries to calm down online publishers about the implications of the introduction of new European privacy rules (the need for a transparent justification for its processing), which violation implies fines up to 4% of the company's revenue.
During the last week, Alphabet Inc. grew by 0.87% against the fall of the S&P 500 index by 0.20%.
Support and resistance
During the last two weeks, the stocks are trading flat. The dynamic is ambiguous. The price is testing local support and resistance levels at 1060.00 and 1085.00, respectively. The instrument can restore further. The indicators’ signals are mixed: the price was fixed above the MA (50) and MA (200); MACD histogram is in the negative zone. It is better to open the positions from the key levels.
The comparative analysis of the indicators of the company and its competitors suggests the neutrality of its share prices.
Resistance levels: 1085.00, 1110.00, 1130.00.
Support levels: 1060.00, 1010.00, 990.00.

Trading tips
Long positions can be opened after the price is set above the level of 1085.00. The closing of the profitable positions is possible at the levels of 1110.00, 1130.00 and 1140.00. Stop loss is around 1065.00.
Short positions can be opened after the price is set below the level of 1060.00 with the targets at 1020.00–1010.00. Stop loss is 1080.00.
Implementation period: 3 days.
Q1 2018 sales of smart Home Alphabet Inc have exceeded the sales of Echos Amazon.com for the first time. The volume of sales of Alphabet Inc. products grew by 36% YoY to 3.2 million devices against 19% YoY growth of Amazon.com to 2.5 million units.
Alphabet Inc. tries to calm down online publishers about the implications of the introduction of new European privacy rules (the need for a transparent justification for its processing), which violation implies fines up to 4% of the company's revenue.
During the last week, Alphabet Inc. grew by 0.87% against the fall of the S&P 500 index by 0.20%.
Support and resistance
During the last two weeks, the stocks are trading flat. The dynamic is ambiguous. The price is testing local support and resistance levels at 1060.00 and 1085.00, respectively. The instrument can restore further. The indicators’ signals are mixed: the price was fixed above the MA (50) and MA (200); MACD histogram is in the negative zone. It is better to open the positions from the key levels.
The comparative analysis of the indicators of the company and its competitors suggests the neutrality of its share prices.
Resistance levels: 1085.00, 1110.00, 1130.00.
Support levels: 1060.00, 1010.00, 990.00.
Trading tips
Long positions can be opened after the price is set above the level of 1085.00. The closing of the profitable positions is possible at the levels of 1110.00, 1130.00 and 1140.00. Stop loss is around 1065.00.
Short positions can be opened after the price is set below the level of 1060.00 with the targets at 1020.00–1010.00. Stop loss is 1080.00.
Implementation period: 3 days.


No comments:
Write comments